What is Spinner?
This activity allows the user to explore experimental and theoretical probabilities adding and removing sections of a circle.
When a section is added the applet divides the area of the circle into equal portions. When this occurs, the probability that the spinner will land on a particular color is equal to that of any other color because the size of the sectors are equal.
Theoretical probability is the probability based on the size of the sector compared to the whole circle. So if there are two equal size sectors you would expect it to land on one of the sectors one out of two spins. The experimental probability is the actual outcome after running an experiment a given number of trials.
Probability began in the middle of the seventeenth century by a man named Pascal. One day a man proposed a question about gambling. His question was "If I play a game that I have eight rolls to roll a six and I fail the first three times, how much of my bet should I get back?" The game involved chance just as most of games do now, such as Monopoly and card games. Las Vegas is a city that is dominated by people that have invested in this field of mathematics. Today, probability has found its way into the fields of science, medicine, and statistics.
How Do I Use This Activity?
This activity allows the user to explore experimental and theoretical probabilities by adding and removing sections of a circle.
Controls and Output
-
In this version of the Spinner, the sizes of the sections are fixed and evenly divided:
-
To increase the number of sections by 1, click on the
+1 button next to the
Number of sections [___]: display; to decrease the number of sections by 1, click on the
-1 button. Observe the current number of sections in the
Number of sections [___] space. Here the number of sections is 4:
-
To simulate spinning the spinner, click on the
Spin button:

-
To change the number of spins simulated each time, click
Spin and type the desired number in the
How many spins? [___] space. Here the number of spins is 1:

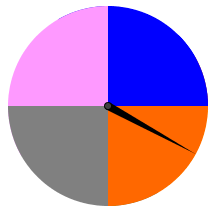
- The program tells you which section the pointer is on ( The pointer is on Blue/Magenta/etc.) and the number of times the spinner has been spun ( Spins So Far:).
-
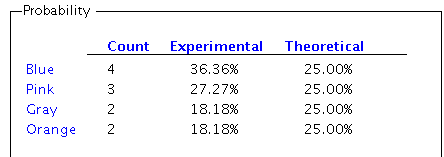
The chart at the bottom of the program tells you the
Experimental Probability,
Theoretical Probability, and
Count (the number of times the pointer has landed on that section) for each section.
-
By clicking on the
Show Results Frame button the user can view an external window that displays the experimental results in the
form of a piechart.
-
You can clear out all of the experimental data and start fresh with zero spins by clicking
on
New Experiment.

-
To change the color of a section, simply click on it. A dialog will pop up that will allow
you to choose a color from a list. Click
Ok to complete the change
Description
This activity allows the user to explore experimental and theoretical probabilities by adding and removing sections of a circle. This activity would work well in groups of two for about fifteen to twenty minutes if you use the exploration questions and ten minutes otherwise.
Place in Mathematics Curriculum
This activity can be used to:
- introduce the notions of chance and probability
- show the difference between experimental and theoretical probability
- motivate the connection between probability and geometry
Standards Addressed
Grade 3
-
Statistics and Probability
- The student demonstrates a conceptual understanding of probability.
Grade 4
-
Statistics and Probability
- The student demonstrates a conceptual understanding of probability and counting techniques.
Grade 5
-
Statistics and Probability
- The student demonstrates a conceptual understanding of probability and counting techniques.
Grade 6
-
Statistics and Probability
- The student demonstrates a conceptual understanding of probability and counting techniques.
Grade 7
-
Statistics and Probability
- The student demonstrates a conceptual understanding of probability and counting techniques.
Grade 8
-
Statistics and Probability
- The student demonstrates a conceptual understanding of probability and counting techniques.
Grade 9
-
Statistics and Probability
- The student demonstrates a conceptual understanding of probability and counting techniques.
Grade 10
-
Statistics and Probability
- The student demonstrates a conceptual understanding of probability and counting techniques.
Grade 3
-
Statistics, Data Analysis, and Probability
- 1.0 Students conduct simple probability experiments by determining the number of possible outcomes and make simple predictions
Grade 4
-
Statistics, Data Analysis, and Probability
- 2.0 Students make predictions for simple probability situations
Sixth Grade
-
Statistics and Probability
- Develop understanding of statistical variability.
Seventh Grade
-
Statistics and Probability
- Investigate chance processes and develop, use, and evaluate probability models.
Statistics and Probability
-
Conditional Probability and the Rules of Probability
- Understand independence and conditional probability and use them to interpret data
- Use the rules of probability to compute probabilities of compound events in a uniform probability model
-
Making Inferences and Justifying Conclusions
- Understand and evaluate random processes underlying statistical experiments
- Make inferences and justify conclusions from sample surveys, experiments, and observational studies
-
Using Probability to Make Decisions
- Calculate expected values and use them to solve problems
- Use probability to evaluate outcomes of decisions
Grade 5
-
Number and Operations, Measurement, Geometry, Data Analysis and Probability, Algebra
- COMPETENCY GOAL 4: The learner will understand and use graphs and data analysis.
Grade 6
-
Number and Operations, Measurement, Geometry, Data Analysis and Probability, Algebra
- COMPETENCY GOAL 4: The learner will understand and determine probabilities.
Advanced Functions and Modeling
-
Data Analysis and Probability
- Competency Goal 1: The learner will analyze data and apply probability concepts to solve problems.
Integrated Mathematics
-
Data Analysis and Probability
- Competency Goal 3: The learner will analyze data and apply probability concepts to solve problems.
AP Statistics
-
Data Analysis and Probability
- Competency Goal 3: The learner will collect and analyze data to solve problems.
-
Number and Operations
- Competency Goal 1: The learner will analyze univariate data to solve problems.
3rd Grade
-
Data Analysis
- Content Standard 5.0 The student will understand and apply basic statistical and probability concepts in order to organize and analyze data and to make predictions and conjectures.
Grade 5
-
Probability and Statistics
- 12. The student describes and predicts the results of a probability experiment.
Grade 6
-
Probability and Statistics
- 9. The student uses experimental and theoretical probability to make predictions.
Grade 8
-
Probability and Statistics
- 11. The student applies concepts of theoretical and experimental probability to make predictions.
Textbooks Aligned
Grade Six
-
How Likely Is It?
- Investigation Three: Using Spinners to Predict Chance
Grade Seven
-
What Do You Expect?
- Investigation One: Evaluating Games of Chance
- Investigation Two: Analyzing Number-Cube Games
- Investigation Three: Probability and Area
6th
-
Module 2 - Math Detectives
- Section 1: Probability
7th
-
Module 2 - Bright Ideas
- Section 5: Probability
Book 2
-
Chance Encounters
- Lesson 4: Spin with the Cover-Up Game
- Lesson 5: The Mystery Spinner Game
- Lesson 6: Designing Mystery Spinner Games
Book 3
-
Looking Behind the Numbers
- Lesson 8: The Mysterious Footprint
Grade 8
-
Great Expectations
- Variability
- Chance
- Sample Size
- Probability
- Combinations
- Simulations
-
Insights into Data
- Understanding Graphs
- Gathering Data
- Bias
- Representation of Data
- Correlations
Grade 5
-
Taking A Chance
- Fairness
- Estimating and Computing Chance
Grade 6
-
Dealing With Data
- Histograms
- Mean, Median, Mode and Range
-
Tracking Graphs
- Interpreting Graphs
- Looking at a Graph's global features
Grade 7
-
Decision Making
- Graphs of Data
- Constraints
- Graphing Inequalities
-
Statistics and the Environment
- Collecting Data
- Mean, Median, Mode and Range
- Graphs and Tables
Be Prepared to
- give implicit directions on what they are to do. For example "Today we are going to experimentwith the spinner applet and see how changing the number of sectors effects the chances that thesector will be landed on ..."
- answer the question "How do I figure out the measurement in degrees?"
- discuss the geometry of circles