Note: This discussion is based on the Gathering Information from Graphs Discussion.
Student: I have figured out how to read simple graphs, and I hope it will help me to learn how to make new graphs from old.
Mentor: What do you mean?
Student: I have seen people looking at a graph of distance vs. time, for example, and sketching the graph of velocity vs. time for the same movement.
Mentor: Let us try to do it for the graph we used before :

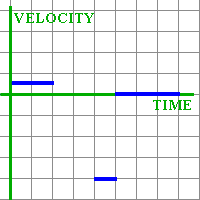
Student: I can already see how to make velocity graph for the straight line parts, because they describe movement with constant velocity. For the first two seconds, the person moved with velocity of 1/2 meter per second; during the fifth second, with velocity of -4 meters per second (it is negative because the distance from zero was decreasing); and for the last three seconds, the person did not move at all, so the velocity was zero. I can sketch that:

Student: But what about the time between two and four seconds from the start? I see that the person was moving quite fast at the beginning of that time, but slowed down more and more.
Mentor: You can use approximations. You can divide this time period into several "pieces" and pretend that velocity did not change during each of them. This is one of the most common methods of calculus. The more pieces, or intervals, you have...
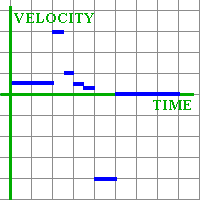
Student: The better I will approximate the real situation. Let me do half-second intervals. From 2 to 2.5 seconds, the person covered about 1.5 meters... Wait, I better make a table:

| Time | Distance covered | Velocity |
| 2 to 2.5 | 1.5 | 3 |
| 2.5 to 3 | .5 | 1 |
| 3 to 3.5 | .25 | .5 |
| 3.5 to 4 | .1 | .2 |
Mentor: You can already make an approximate graph of velocity for the whole time.
Student draws:

Mentor: I would like to point something out. Do you think it is possible or not to change velocity instantly, as our graph suggests?
Student: I do not think so. It takes time to change velocity. You can't go from .5 meters per second to 3 meters per second in no time, as our graph suggests. In real life, you will have to accelerate from one velocity to another, even if you do it very fast.
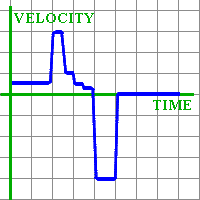
Mentor: I suggest we smooth the graph out a little to make it more realistic, like this:

Student: Now we did it! We made velocity graph out of distance graph!
Mentor: Let us now take this graph and build a graph of acceleration by it. Remember, acceleration is change in velocity.
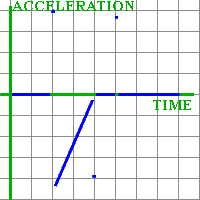
Student: So if velocity does not change, acceleration is zero. When velocity increases, acceleration is positive, and when velocity decreases, acceleration is negative. In our velocity graph, in the period from 2 to 4 seconds velocity decreases fast at first and then slower and slower. By the end of this period, velocity stays almost the same. So acceleration will go from some negative number to almost zero, for time from 2 to 4 seconds. The places where we smoothed the velocity graph out mean very fast changes in velocity, that is, large numbers for acceleration. My graph looks strange:

Mentor: This only happens because the original movement is strange. By the way, is it realistic that acceleration changes instantly?
Student: Not really, so we may need to smooth out the acceleration graph. It is interesting that in every place where the distance graph is a straight line, the acceleration is zero.
Mentor: It makes sense, though.
Student: Of course it does: if the distance vs. time graph is a straight line, then velocity is constant. Constant velocity means zero acceleration.