Student: When do we use mean and when do we use median?
Mentor: It is up to the researcher to decide. The important thing is to make sure you tell which method you use. Unfortunately, too often people call mean, median and mode by the same name: average.
Student: What is mode?
Mentor: The easiest way to look at modes is on histograms. Let us imagine a histogram with the smallest possible class intervals (see also Increase or Decrease? Discussion ).
Student: Then every different piece of data contributes to only one bin in the histogram.
Mentor: Now let us consider the value that repeats most often. It will look like the highest peak on our histogram. This value is called the mode. A histogram would have no mode if all the data points occur the same number of times. If there are several modes, data is called multimodal. Can you make an example of trimodal data?
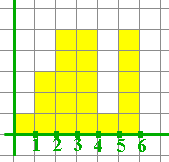
Student: Data with three modes? Sure. Say, if somebody counted numbers of eggs in 20 tree creepers' nests, they could get these numbers: 4, 3, 1, 2, 6, 3, 4, 5, 2, 6, 4, 3, 3, 3, 6, 4, 6, 4, 2, 6. I can make a histogram:

Mentor: There are three values that appear most often: 3, 4, and 6, so all these values are modes. Modes are often used for so-called qualitative data, that is, data that describes qualities rather than quantities.
Student: What about median?
Mentor: Median is simply the middle piece of data, after you have sorted data from the smallest to the largest. In other words, the median is the number that splits the sorted data into two sets that are equal in the number of data values. For example, the median of the data set 1, 3, 6, 8, 9 would be 6 since two numbers are to the left of 6 and two numbers are to the right of 6. But the median of the data set 1, 3, 6, 7, 8, 9 would be the average of 6 and 7, or (6+7)/2 = 6.5, since a set with an even number of data values doesn't really have a middle.
Student: What happens when the data contains duplicates, like the eggs in the nests example?
Mentor: In your nest example, you sort the numbers first: 1, 2, 2, 2, 3, 3, 3, 3, 3, 4, 4, 4, 4, 4, 5, 6, 6, 6, 6, 6 eggs. There is an even number of values, so the middle (or median) is between the first and second 4 (the 10th and 11th values). Because they are the same, their average is also 4, so the median is 4. What would the median be if we had 19 nests instead of 20 and the missing nest was the one with a single egg in it?
Student: In that case, the sorted data would be 2, 2, 2, 3, 3, 3, 3, 3, 4, 4, 4, 4, 4, 5, 6, 6, 6, 6, 6 and the median would be the 10th number which is the second 4.
Mentor: Excellent!
Student: The last type of averages I would like to know about is mean.
Mentor: Sometimes it is called arithmetic mean, because there are other things in math that are called mean. For example, there is a geometric mean and a harmonic mean. The arithmetic mean of a set of values is a sum of all values, divided by their number. In your nest example,
mean = (4+3+1+2+6+3+4+5+2+6+4+3+3+3+6+4+6+4+2+6)/20 = 3.85
Student: Which one is better: mean, median or mode?
Mentor: It depends on your goals. I can give you some examples to show you why. Consider a company that has nine employees with salaries of 35,000 a year, and their supervisor makes 150,000 a year. If you want to describe the typical salary in the company, which statistics will you use?
Student: I will use mode (35,000), because it tells what salary most people get.
Mentor: What if you are a recruiting officer for the company that wants to make a good impression on a prospective employee?
Student: The mean is (35,000*9 + 150,000)/10 = 46,500 I would probably say: "The average salary in our company is 46,500" using mean.
Mentor: In each case, you have to decide for yourself which statistics to use.
Student: It also helps to know which ones other people are using!