Aligned Resources

North Carolina Standard Course of Study
Grade 7
Number and Operations, Measurement, Geometry, Data Analysis and Probability, Algebra
COMPETENCY GOAL 4: The learner will understand and use graphs and data analysis.

Lessons  •  Activities  •  Show All

Lessons (8)

Students discover algorithms as they sort shapes into Venn diagrams. Then students compare the efficiency of their algorithms using box plots.

Audiences: Grades 6-8, Grades 9-12

Primary Subjects: Algebra, Discrete, Geometry, Number and Operations

Related Topics: algorithm, box and whisker, box plot, geometry, pattern, polygon, sets, venn diagram

Introduces students to quartiles and box plots.

Audiences: Grades 6-8, Grades 9-12

Primary Subjects: Statistics

Related Topics: box and whisker, box plot, data, mean, measures of central tendency, median, mode, quartile, range, statistics

Introduction and fine points of using bar graphs and histograms.

Audiences: Grades 3-5, Grades 6-8, Grades 9-12

Primary Subjects: Statistics

Related Topics: bar graph, categorical, comparing, counting, data, graph, histogram, intervals, length, mean, numerical, scale, skewed distribution, standard deviation, statistics

Introduces statistical measures of center.

Audiences: Grades 6-8, Grades 9-12

Primary Subjects: Statistics

Related Topics: arithmetic, histogram, mean, measures of central tendency, median, mode, range, sets, statistics, sum

This lesson will challenge students to think creatively by having them design and build water balloon catchers from random scrap materials, while requiring them to take into consideration a multitude of variables. Students will then construct at least two bar graphs to be used in a commercial advocating the purchase of their group's catcher.

Audiences: Grades 3-5, Grades 6-8

Primary Subjects: Statistics

Related Topics: bar graph, counting, data, graph, histogram, intervals, lines, mean, median, mode, pie chart, probability, range, skewed distribution, standard deviation, statistics

Looks at statistics and data analysis concepts from the practical questions that arise in everyday life.

Audiences: Grades 6-8, Grades 9-12

Primary Subjects: Statistics

Related Topics: bar graph, fractions, histogram, percentages, percents, statistics

Introduces students to stem-and-leaf plots and calculating the mean, median, and mode from the plots.

Audiences: Grades 3-5, Grades 6-8, Grades 9-12

Primary Subjects: Statistics

Related Topics: arithmetic, data, data plot, graph, histogram, mean, measures of central tendency, median, mode, range, statistics, stem and leaf

Students learn about the difference between univariate and bivariate data and understand how to choose the best graph to display the data.

Audiences: Grades 6-8, Grades 9-12

Primary Subjects: Statistics

Related Topics: bar graph, bivariate, box and whisker, box plot, cartesian coordinate, categorical, circle graph, circles, coordinate, coordinate plane, correlation, curve fitting, data, data plot, deviations, double bar graph, graph, histogram, intervals, mean, measures of central tendency, median, mode, numerical, outlier, percentages, percents, pie chart, quartile, range, regression, residual, scale, scatter plot, skewed distribution, standard deviation, statistics, stem and leaf, table, univariate

Activities (10)

Run a simulation of how a fire spreads through a stand of trees, learning about probability and chaos. Track the results of multiple burns and use the data to draw conclusions.

Audiences: Grades 6-8, Grades 9-12, Undergraduate

Primary Subjects: Modeling, Probability, Statistics

Related Topics: agent modeling, chaos, conditional probability, experimental probability, probability simulation, simulation, theoretical probability

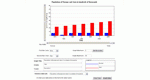
Enter data to create a bar graph, then change many settings for the graph's appearance.

Audiences: Grades 3-5, Grades 6-8, Grades 9-12

Primary Subjects: Graphs, Statistics

Related Topics: bar graph, data plot, histogram, statistics

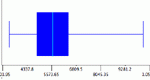
Students can create box plots for either built-in or user-specified data as well as experiment with outliers. User may choose to use or not use the median for calculation of interquartile range.

Audiences: Grades 6-8, Grades 9-12, Undergraduate

Primary Subjects: Graphs, Statistics

Related Topics: box and whisker, box plot, coordinate plane, data plot, median, outlier, percentages, quartile, range, scale, skewed distribution, statistics

Enter your own data categories and the value of each category to create a pie chart. There are also built in data sets which can be viewed.

Audiences: Grades 3-5, Grades 6-8, Grades 9-12

Primary Subjects: Fractions, Graphs, Statistics

Related Topics: angles, area, circle graph, circles, data plot, fractions, percentages, pie chart, proportion, statistics

View histograms for built-in or user-specified data. Experiment with how the size of the class intervals influences the appearance of the histogram. Parameters: Data sets, class sizes.

Audiences: Grades 3-5, Grades 6-8, Grades 9-12, Undergraduate

Primary Subjects: Graphs, Statistics

Related Topics: counting, data plot, graph, histogram, intervals, mean, range, skewed distribution, slides, standard deviation

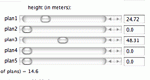
Enter data and view the mean, median, variance, and standard deviation of the data set. Parameters: Number of observations, range for observations, which statistics to view, identifiers for the data.

Audiences: Grades 3-5, Grades 6-8, Grades 9-12

Primary Subjects: Statistics

Related Topics: decimals, deviations, mean, measures of central tendency, median, mode, range, simulation, standard deviation, statistics, variance

Enter data to create a double bar graph, then manipulate the graph's maximum and minimum values.

Audiences: Grades 6-8, Grades 9-12

Primary Subjects: Graphs, Statistics

Related Topics: bar graph, data plot, double bar graph

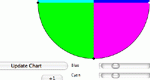
Create a pie chart, adjusting the size of the divisions using your mouse or by entering values. Parameters: Number of sections, size of sections, whether to use percents or fractions.

Audiences: Grades 3-5, Grades 6-8, Grades 9-12

Primary Subjects: Graphs, Statistics

Related Topics: angles, area, circle graph, circles, fractions, percentages, percents, pie chart, proportion, statistics

PlopIt allows users to build dot plots of data using the mouse. View how the mean, median, and mode change as entries are added to the plot. Parameters: Range for observations.

Audiences: Grades 3-5, Grades 6-8, Grades 9-12

Primary Subjects: Graphs, Statistics

Related Topics: bar graph, data plot, graph, histogram, mean, measures of central tendency, median, mode, range, statistics

View stem-and-leaf plots of your own data, and then practice finding means, medians and modes. Stem and Leaf Plotter is one of the Interactivate assessment explorers.

Audiences: Grades 3-5, Grades 6-8, Grades 9-12

Primary Subjects: Graphs, Statistics

Related Topics: data plot, graph, mean, measures of central tendency, median, mode, range, statistics, stem and leaf