Aligned Resources

North Carolina Standard Course of Study
AP Statistics
Algebra
Competency Goal 4: The learner will analyze bivariate data to solve problems.

Activities (5)

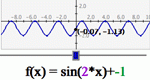
Enter a set of data points, then derive a function to fit those points. Manipulate the function on a coordinate plane using slider bars. Learn how each constant and coefficient affects the resulting graph.

Audiences: Grades 6-8, Grades 9-12, Undergraduate

Primary Subjects: Algebra, Graphs, Modeling, Statistics, Trigonometry

Related Topics: algebra, cartesian coordinate, coordinate, coordinate plane, coordinate system, cosecant, cosine, cotangent, curve fitting, data plot, deviations, exponential, exponents, function properties, functions, graph, grouping, integers, intervals, inverse, linear equations, linear functions, logarithm, multiplication, parabola, polynomial, positive part of the operand, pre-calculus, range, secant, sine, slope, tangent, trigonometry

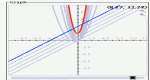
Enter a set of data points and a function or multiple functions, then manipulate those functions to fit those points. Manipulate the function on a coordinate plane using slider bars. Learn how each constant and coefficient affects the resulting graph.

Audiences: Grades 6-8, Grades 9-12, Undergraduate

Primary Subjects: Algebra, Calculus, Modeling, Statistics, Trigonometry

Related Topics: algebra, calculus, cartesian coordinate, coordinate, coordinate plane, coordinate system, cosecant, cosine, cotangent, curve fitting, data plot, deviations, flyer, function properties, functions, graph, linear functions, logarithm, parabola, polynomial, pre-calculus, secant, sine, slides, slope, squares, tangent, trigonometry

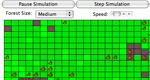
Experiment with a simple ecosystem consisting of grass, rabbits, and wolves, learning about probabilities, chaos, and simulation.

Audiences: Grades 3-5, Grades 6-8, Grades 9-12

Primary Subjects: Calculus, Graphs, Modeling, Probability, Statistics

Related Topics: agent modeling, calculus, chaos, graph, iteration, pattern, predator-prey, probability simulation, random number, simulation, statistics

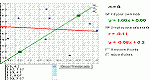
Plot a bivariate data set, determine the line of best fit for their data, and then check the accuracy of your line of best fit.

Audiences: Grades 6-8, Grades 9-12, Undergraduate

Primary Subjects: Algebra, Calculus, Graphs, Statistics

Related Topics: calculus, cartesian coordinate, coordinate plane, correlation, curve fitting, data plot, deviations, residual, statistics

Models how a population of susceptible, infected, and recovered people is affected by a disease.

Audiences: Grades 3-5, Grades 6-8, Grades 9-12, Undergraduate

Primary Subjects: Modeling, Probability

Related Topics: agent modeling, chaos, graph, iteration, probability simulation, simulation, statistics