Aligned Resources

Virginia Standards of Learning
7th Grade
Probability and Statistics
7.17 The student, given a problem situation, will collect, analyze, display, and interpret data, using a variety of graphical methods, including frequency distributions; line plots; histograms; stem-and-leaf plots; box-and-whisker plots; and scattergrams.

Lessons  •  Activities  •  Show All

Lessons (9)

Students discover algorithms as they sort shapes into Venn diagrams. Then students compare the efficiency of their algorithms using box plots.

Audiences: Grades 6-8, Grades 9-12

Primary Subjects: Algebra, Discrete, Geometry, Number and Operations

Related Topics: algorithm, box and whisker, box plot, geometry, pattern, polygon, sets, venn diagram

Introduces students to quartiles and box plots.

Audiences: Grades 6-8, Grades 9-12

Primary Subjects: Statistics

Related Topics: box and whisker, box plot, data, mean, measures of central tendency, median, mode, quartile, range, statistics

Introduces students to plotting points on the Cartesian coordinate system -- an alternative to "Graphing and the Coordinate Plane."

Audiences: Grades 3-5, Grades 6-8, Grades 9-12

Primary Subjects: Algebra, Geometry, Statistics

Related Topics: cartesian coordinate, coordinate, coordinate plane, coordinate system, functions, graph, linear equations, linear functions, negative number, planes, slope

Students learn basic ideas about graphing points on the coordinate plane.

Audiences: Grades 3-5, Grades 6-8, Grades 9-12

Primary Subjects: Algebra, Geometry

Related Topics: algebra, axis, cartesian coordinate, coordinate, coordinate plane, coordinate system, graph, linear functions, lines, negative number, number line, pattern, planes, positive number, quadrant, slope

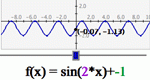
Demonstrates the connections between formulas and graphs.

Audiences: Grades 6-8, Grades 9-12

Primary Subjects: Algebra

Related Topics: algebra, cartesian coordinate, constant, coordinate, coordinate plane, coordinate system, functions, graph, input, intercept, linear equations, linear functions, lines, negative number, output, parabola, slope

Introduction and fine points of using bar graphs and histograms.

Audiences: Grades 3-5, Grades 6-8, Grades 9-12

Primary Subjects: Statistics

Related Topics: bar graph, categorical, comparing, counting, data, graph, histogram, intervals, length, mean, numerical, scale, skewed distribution, standard deviation, statistics

Introduces the basic ideas needed for understanding linear functions.

Audiences: Grades 6-8, Grades 9-12

Primary Subjects: Algebra, Discrete

Related Topics: addition, algebra, arithmetic, associative, commutative, dependent, distributive, division, equivalent, function properties, functions, independent, input, integers, intercept, linear equations, linear functions, multiplication, order of operations, output, pattern, slope, subtraction, table, variable

Introduces students to stem-and-leaf plots and calculating the mean, median, and mode from the plots.

Audiences: Grades 3-5, Grades 6-8, Grades 9-12

Primary Subjects: Statistics

Related Topics: arithmetic, data, data plot, graph, histogram, mean, measures of central tendency, median, mode, range, statistics, stem and leaf

Students learn about the difference between univariate and bivariate data and understand how to choose the best graph to display the data.

Audiences: Grades 6-8, Grades 9-12

Primary Subjects: Statistics

Related Topics: bar graph, bivariate, box and whisker, box plot, cartesian coordinate, categorical, circle graph, circles, coordinate, coordinate plane, correlation, curve fitting, data, data plot, deviations, double bar graph, graph, histogram, intervals, mean, measures of central tendency, median, mode, numerical, outlier, percentages, percents, pie chart, quartile, range, regression, residual, scale, scatter plot, skewed distribution, standard deviation, statistics, stem and leaf, table, univariate

Activities (2)

Enter a set of data points, then derive a function to fit those points. Manipulate the function on a coordinate plane using slider bars. Learn how each constant and coefficient affects the resulting graph.

Audiences: Grades 6-8, Grades 9-12, Undergraduate

Primary Subjects: Algebra, Graphs, Modeling, Statistics, Trigonometry

Related Topics: algebra, cartesian coordinate, coordinate, coordinate plane, coordinate system, cosecant, cosine, cotangent, curve fitting, data plot, deviations, exponential, exponents, function properties, functions, graph, grouping, integers, intervals, inverse, linear equations, linear functions, logarithm, multiplication, parabola, polynomial, positive part of the operand, pre-calculus, range, secant, sine, slope, tangent, trigonometry

View stem-and-leaf plots of your own data, and then practice finding means, medians and modes. Stem and Leaf Plotter is one of the Interactivate assessment explorers.

Audiences: Grades 3-5, Grades 6-8, Grades 9-12

Primary Subjects: Graphs, Statistics

Related Topics: data plot, graph, mean, measures of central tendency, median, mode, range, statistics, stem and leaf