Aligned Resources

Texas Essential Knowledge and Skills
Grade 5
Probability and Statistics
13. The student solves problems by collecting, organizing, displaying, and interpreting sets of data.

Lessons  •  Activities  •  Show All

Lessons (2)

Students learn what bar graphs are used for, how to interpret the data presented, and how to organize their own data using bar graphs.

Audiences: Grades 3-5, Grades 6-8

Primary Subjects: Statistics

Related Topics: bar graph, categorical, data, height, scale, statistics

This lesson allows students to learn what bar graphs are used for, how to interpret the data presented, and how to organize their own data using bar graphs.

Audiences: Grades 3-5

Primary Subjects: Statistics

Related Topics: bar graph, categorical, circles, counting, data, squares, statistics, triangle

Activities (3)

Enter data to create a bar graph, then change many settings for the graph's appearance.

Audiences: Grades 3-5, Grades 6-8, Grades 9-12

Primary Subjects: Graphs, Statistics

Related Topics: bar graph, data plot, histogram, statistics

Enter your own data categories and the value of each category to create a pie chart. There are also built in data sets which can be viewed.

Audiences: Grades 3-5, Grades 6-8, Grades 9-12

Primary Subjects: Fractions, Graphs, Statistics

Related Topics: angles, area, circle graph, circles, data plot, fractions, percentages, pie chart, proportion, statistics

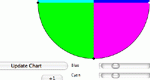
Create a pie chart, adjusting the size of the divisions using your mouse or by entering values. Parameters: Number of sections, size of sections, whether to use percents or fractions.

Audiences: Grades 3-5, Grades 6-8, Grades 9-12

Primary Subjects: Graphs, Statistics

Related Topics: angles, area, circle graph, circles, fractions, percentages, percents, pie chart, proportion, statistics