Section 3: Misleading Graphs

Math Thematics 1st Ed. Book 3
Module 8 - Making an Impact
Section 3: Misleading Graphs

Activities (3)

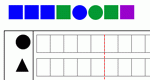
Sort colored shapes into a bar graph. Practice sorting by shape or by color. Appropriate for elementary grades. Bar Graph Sorter is one of the Interactivate assessment explorers.

Audiences: Grades 3-5, Grades 6-8

Primary Subjects: Geometry, Graphs, Statistics

Related Topics: bar graph, circles, counting, sorter, squares, statistics

View histograms for built-in or user-specified data. Experiment with how the size of the class intervals influences the appearance of the histogram. Parameters: Data sets, class sizes.

Audiences: Grades 3-5, Grades 6-8, Grades 9-12, Undergraduate

Primary Subjects: Graphs, Statistics

Related Topics: counting, data plot, graph, histogram, intervals, mean, range, skewed distribution, slides, standard deviation

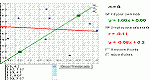
Plot a bivariate data set, determine the line of best fit for their data, and then check the accuracy of your line of best fit.

Audiences: Grades 6-8, Grades 9-12, Undergraduate

Primary Subjects: Algebra, Calculus, Graphs, Statistics

Related Topics: calculus, cartesian coordinate, coordinate plane, correlation, curve fitting, data plot, deviations, residual, statistics