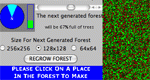
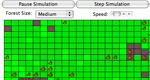
Students run a simulation of how a fire will spread through a stand of trees, learning about probability and chaos. Parameters: Forest density, wind direction, size of forest.
Audiences:
Grades 6-8, Grades 9-12, Undergraduate
Primary Subjects:
Discrete, Fractions, Modeling, Probability
Related Topics:
agent modeling, chaos, conditional probability, experimental probability, iteration, percentages, percents, probability simulation, proportion, simulation, skewed distribution, variance
View histograms for built-in or user-specified data. Experiment with how the size of the class intervals influences the appearance of the histogram. Parameters: Data sets, class sizes.
Audiences:
Grades 3-5, Grades 6-8, Grades 9-12, Undergraduate
Primary Subjects:
Graphs, Statistics
Related Topics:
counting, data plot, graph, histogram, intervals, mean, range, skewed distribution, slides, standard deviation
Experiment with a simple ecosystem consisting of grass, rabbits, and wolves, learning about probabilities, chaos, and simulation.
Audiences:
Grades 3-5, Grades 6-8, Grades 9-12
Primary Subjects:
Calculus, Graphs, Modeling, Probability, Statistics
Related Topics:
agent modeling, calculus, chaos, graph, iteration, pattern, predator-prey, probability simulation, random number, simulation, statistics
View stem-and-leaf plots of your own data, and then practice finding means, medians and modes. Stem and Leaf Plotter is one of the Interactivate assessment explorers.
Audiences:
Grades 3-5, Grades 6-8, Grades 9-12
Primary Subjects:
Graphs, Statistics
Related Topics:
data plot, graph, mean, measures of central tendency, median, mode, range, statistics, stem and leaf