Section 1: Graphs and Functions

Math Thematics 2nd Ed. 8th
Module 6 - Visualizing Change
Section 1: Graphs and Functions

Lessons  •  Activities  •  Show All

Lessons (1)

Introduces students to the vertical line test for graphs of functions.

Audiences: Grades 6-8, Grades 9-12, Undergraduate

Primary Subjects: Algebra, Discrete

Related Topics: algebra, cartesian coordinate, constant, continuous distribution, coordinate, coordinate plane, discontinuous, function properties, functions, graph, input, linear equations, linear functions, lines, output, piecewise, vertical line test

Activities (4)

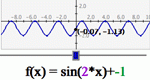
Enter a set of data points, then derive a function to fit those points. Manipulate the function on a coordinate plane using slider bars. Learn how each constant and coefficient affects the resulting graph.

Audiences: Grades 6-8, Grades 9-12, Undergraduate

Primary Subjects: Algebra, Graphs, Modeling, Statistics, Trigonometry

Related Topics: algebra, cartesian coordinate, coordinate, coordinate plane, coordinate system, cosecant, cosine, cotangent, curve fitting, data plot, deviations, exponential, exponents, function properties, functions, graph, grouping, integers, intervals, inverse, linear equations, linear functions, logarithm, multiplication, parabola, polynomial, positive part of the operand, pre-calculus, range, secant, sine, slope, tangent, trigonometry

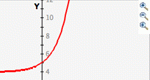
Create graphs of functions and sets of ordered pairs on the same coordinate plane. This is like a graphing calculator with advanced viewing options.

Audiences: Grades 6-8, Grades 9-12, Undergraduate

Primary Subjects: Algebra, Calculus, Graphs, Statistics, Trigonometry

Related Topics: algebra, calculus, cartesian coordinate, coordinate, coordinate plane, coordinate system, cosecant, cosine, cotangent, curve fitting, data plot, exponential, exponents, function properties, functions, graph, graph theory, intervals, linear equations, linear functions, logarithm, parabola, polynomial, positive part of the operand, pre-calculus, range, secant, sine, slope, tangent, trigonometry

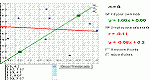
Plot a bivariate data set, determine the line of best fit for their data, and then check the accuracy of your line of best fit.

Audiences: Grades 6-8, Grades 9-12, Undergraduate

Primary Subjects: Algebra, Calculus, Graphs, Statistics

Related Topics: calculus, cartesian coordinate, coordinate plane, correlation, curve fitting, data plot, deviations, residual, statistics

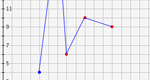
Learn about the vertical line test for functions by trying to connect points in the plane to build a function. When you have connected all of the points, you will be told if your graph is a valid graph of a function. Vertical Line Test is one of the Interactivate assessment explorers.

Audiences: Grades 6-8, Grades 9-12

Primary Subjects: Algebra, Discrete, Graphs

Related Topics: cartesian coordinate, coordinate plane, function properties, functions, graph, lines, pre-calculus, vertical line test