What is Cross Section Flyer?
Cross sections are the two-dimensional representations created at the intersection of a "slicing plane" and a three-dimensional object. The cross section is the portion of the object shown at slice. Cross sections have interesting properties and help us better understand cones, cylinders, and polyhedra. In particular, conic sections are cross sections of a cone or double cone and can be explored further in the Conic Flyer applet.
In this applet, you can explore cross sections of various cones, cylinders, prisms, and pyramids. By changing the properties of the three-dimensional object and observing the different cross sections, you'll discover new ways to create a variety of familiar shapes. To help you visualize the cross sections, they are displayed on a familiar two-dimensional graph to the right of the three-dimensional figure.
The translation between two- and three-dimensional space is an important skill. As you play with this applet, be careful to understand how each graphical representation is derived from the three-dimensional object.
How Do I Use This Activity?
This applet allows the user to explore the world of transformations, reflections, and rotations. It allows the user to transform polygons with up to 12 user defined vertices on the coordinate plane.
Controls and Output
This activity allows the user to generate cross sections of a variety of solids by using radio buttons and slider bars to select the solid type, the solid size, and the position of the slice. The outline of each cross section is plotted on the graph as it is formed.
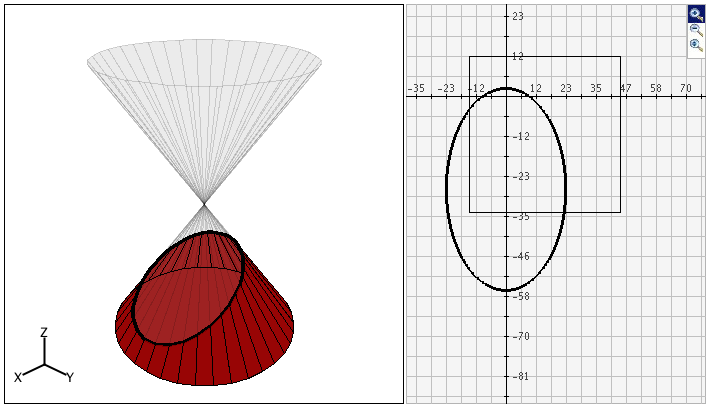
On the left of the page there is the default shape which is the double cone. On the right side of the page there is a graph which has the default cross section of an ellipse.
Zoom/Pan buttons. In the upper right corner of the graph, there are three buttons with pictures of magnifying glasses. From top to bottom these buttons represent zoom in, zoom out, and pan, respectively.
-
To zoom in, click the top button to depress it, then click and drag over the area of the
graph that you wish to magnify. The images below show first the process of dragging a box
around a desired zoom area with the mouse (left), and then the resulting zoomed image
after the mouse button is released (right). Note that after the zoom-in has been
performed, the zoom-in button at top right is no longer depressed.
-
To zoom out, simply click the second of the three zoom buttons. The graph will
automatically zoom out by doubling the min and max values of the axes.
-
To use the pan feature, click the bottom magnifying glass button to depress it. Click and
drag over the graph and the graph will pan around according to the movement of the mouse.
Upon releasing the mouse, the pan button is released.
To change the viewing angle of the solid, the user may click and drag on the solid.
You can choose to reset view or reset graph by clicking on their corresponding buttons beneath the viewing area. Each button will cause the view or the graph to reset to its starting position. It will not reset the cross-section.
The check box below the solid can be used to identify the type of cross section that is
generated by the slice. When the box is unchecked, no identification will appear. When it is
checked, the user will see the name of the cross section, such as circle, ellipse, hyperbola,
parabola, pentagon, and others.

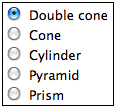
The user may select the type of solid desired by using the radio buttons at the lower left
side of the page.
-
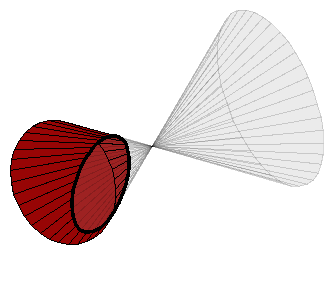
The double cone is a three-dimensional figure which has two cones connecting at their
vertices.
-
The cone is a three-dimensional figure whose base is a circle and whose sides are formed
by rotating a right triangle about its leg which is placed at the center of and
perpendicular to the circle. The point at the top of the cone is called its vertex.
-
The cylinder is three-dimensional figure with two circular bases which are parallel and
congruent.
-
The pyramid is a three-dimensional figure that has a regular polygon as its base and
triangular sides with a common vertex. In a regular polygon, all sides are equal in
length. The number of sides in the base can vary from 3 to 12.
-
The prism is a three-dimensional figure having two congruent, parallel bases that are
regular polygons and lateral faces that are rectangles. The number of sides in the base
can vary from 3 to 12.
The user can use the slider bars to rotate the slice (around the y-axis or the z-axis), move
the slice up or down, or change the dimensions of the solid. If the solid is a double cone,
cone or cylinder, the radius slider bar will change the radius of the circular base.
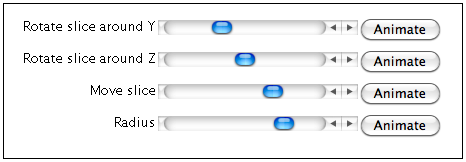
If the solid is a pyramid or prism, the lateral faces slider bar can be used to increase or
decrease the number of sides in the base of the solid. This also changes the number of lateral
faces.
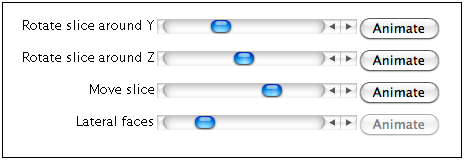
The animate button at the end of each slider bar may be used to automatically move the slider between its endpoints.
The user can choose how the cross-section will be displayed graphically, by choosing how the
axes of the graph are determined. By clicking on the radio buttons at the bottom of the
applet, the user can choose to center axes on the point nearest to origin, the focus of the
conic section (only when working with the cone, double cone, or cylinder), or the centroid of
the cross-section.
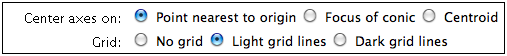
The user can also choose to have no grid lines on the graph, light grid lines, or dark grid lines.
Description
This activity allows the user to explore different cross sections of various cones, cylinders, prisms, and pyramids. Cross sections can be difficult for students to understand, given that the concept requires that students switch between three-dimensional shapes and two-dimensional representations of those shapes. While this applet was designed to help students create and visualize cross sections of different solids, some students may also benefit from hands-on activities where they can physically slice open various solids before attempting more abstract explorations such as this applet.
This activity would work well in groups of two to four for about twenty-five to thirty minutes if you use the exploration questions and five minutes per function type otherwise.
Place in Mathematics Curriculum
This activity can be used to:
- show the relationship between three-dimensional objects and two-dimensional representations
- develop the ability to visualize movements on two- and three-dimensional objects
- assist students in transitioning from concrete to abstract thinking
Standards Addressed
Grade 9
-
Functions and Relationships
- The student demonstrates conceptual understanding of functions, patterns, or sequences including those represented in real-world situations.
- The student demonstrates algebraic thinking.
-
Geometry
- The student demonstrates an understanding of geometric relationships.
- The student solves problems (including real-world situations).
- The student demonstrates a conceptual understanding of geometric drawings or constructions.
Grade 10
-
Functions and Relationships
- The student demonstrates conceptual understanding of functions, patterns, or sequences including those represented in real-world situations.
- The student demonstrates algebraic thinking.
-
Geometry
- The student demonstrates an understanding of geometric relationships.
- The student solves problems (including real-world situations).
- The student demonstrates a conceptual understanding of geometric drawings or constructions.
Geometry
-
Expressing Geometric Properties with Equations
- Translate between the geometric description and the equation for a conic section
-
Geometric Measurement and Dimension
- Visualize relationships between two-dimensional and three- dimensional objects
-
Modeling with Geometry
- Apply geometric concepts in modeling situations
Grades 9-12
-
Geometry
- Analyze characteristics and properties of two- and three-dimensional geometric shapes and develop mathematical arguments about geometric relationships
- Use visualization, spatial reasoning, and geometric modeling to solve problems
Geometry
-
Geometry and Measurement
- Competency Goal 2: The learner will use geometric and algebraic properties of figures to solve problems and write proofs.
Geometry
-
Algebra
- Students will recognize, extend, create, and analyze a variety of geometric, spatial, and numerical patterns; solve real-world problems related to algebra and geometry; and use properties of various geometric figures to analyze and solve problems.
-
Geometry
- Students will investigate, model, and apply geometric properties and relationships and use indirect reasoning to make conjectures; deductive reasoning to draw conclusions; and both inductive and deductive reasoning to establish the truth of statements.
Algebra I
-
Foundation for Functions
- 1. The student understands that a function represents a dependence of one quantity on another and can be described in a variety of ways.
-
Quadratic and Other Nonlinear Functions
- 9. The student understands that the graphs of quadratic functions are affected by the parameters of the function and can interpret and describe the effects of changes in the parameters of quadratic functions.
- 11. The student understands there are situations modeled by functions that are neither linear nor quadratic and models the situations.
Geometry
-
Dimensionality and the Geometry of Location
- 6. The student analyzes the relationship between three- dimensional geometric figures and related two-dimensional representations and uses these representations to solve problems.
- 7. The student understands that coordinate systems provide convenient and efficient ways of representing geometric figures and uses them accordingly.
-
Geometric Patterns
- 5. The student uses a variety of representations to describe geometric relationships and solve problems.
-
Geometric Structure
- 4. The student uses a variety of representations to describe geometric relationships and solve problems. The student is expected to select an appropriate representation (concrete, pictorial, graphical, verbal, or symbolic) in order to solve problems.
Secondary
-
Geometry
- G.12 The student will make a model of a three-dimensional figure from a two-dimensional drawing and make a two-dimensional representation of a three-dimensional object. Models and representations will include scale drawings, perspective drawings, blueprints, or computer simulations.
Be Prepared to
- explain how the two representations are connected
- explain how to predict what a given cross section will look like on a graph
- physically demonstrate slicing solids to create cross sections