What is Conic Flyer?
This activity allows the user to explore the effects of changing the constants in the equations on the graphs of the conic sections including:
- circles
- ellipses
- parabolas
- hyperbolas
This applet allows the user to create graphs of conic sections. Using slider bars, one can manipulate the function to change the constant values and view the effects of those changes.
How Do I Use This Activity?
This activity allows the user to manipulate the graphs of the conic sections by changing the constants in their respective equations. The equation and variable values are displayed and change as the user moves the slider bars. The user may set the sliderbar ranges, as well as the range of the graph.
Controls and Output
-
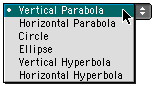
The user may select a conic section equation by choosing from the drop down menu shown
below.
-
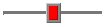
The slider bars may be moved to change the equation of the conic section; an example of a
slider bar is shown below.
-
The range and increment values of the slider bars may be changed by clicking on the
 button and changing the values given in the popup window.
-
The range of the graph's x and y values may also be changed by clicking the
 button and changing the values displayed.
-
To reset the slider bars, conic section graph, and equation to the initial values, press
the
 button.
-
There are three types of grids:
No Grid,
Light Grid Lines, and
Dark Grid Lines. To activate any of these three options, highlight the circle next to the appropriate
option:
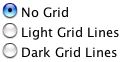
No Grid graph: Light Grid Lines graph: Dark Grid Lines graph: 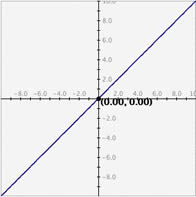
-
Zoom/Pan buttons. In the upper right corner of the graph, there are three buttons with pictures of
magnifying glasses. From top to bottom these buttons represent zoom in, zoom out, and pan,
respectively.
-
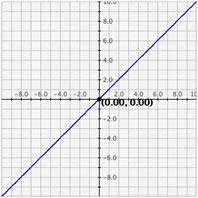
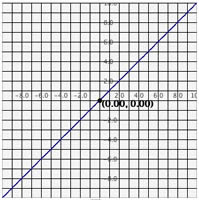
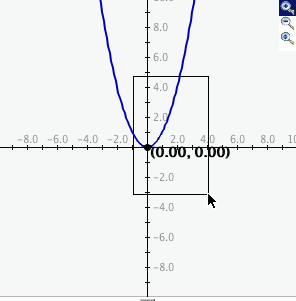
To zoom in, click the top button to depress it, then click and drag over the area of the graph that you wish to magnify. The images below show first the process of dragging a box around a desired zoom area with the mouse (left), and then the resulting zoomed image after the mouse button is released (right). Note that after the zoom-in has been performed, the zoom-in button at top right is no longer depressed.
- To zoom out, simply click the second of the three zoom buttons. The graph will automatically zoom out by doubling the min and max values of the axes.
- To use the pan feature, click the bottom magnifying glass button to depress it. Click and drag over the graph and the graph will pan around according to the movement of the mouse. Upon releasing the mouse, the pan button is released.
-
Description
This activity allows the user to experiment with changing constants and coefficients in a conic section. This activity would work well in groups of two to four for about twenty-five to thirty minutes if you use the exploration questions and five minutes per function type otherwise.
Place in Mathematics Curriculum
This activity can be used to:
- experiment on the graph of a conic section by changing the coefficients and constants
- visualize some of the possible cross sections of an infinite cone
Standards Addressed
Grade 9
-
Functions and Relationships
- The student demonstrates conceptual understanding of functions, patterns, or sequences including those represented in real-world situations.
- The student demonstrates algebraic thinking.
Grade 10
-
Functions and Relationships
- The student demonstrates conceptual understanding of functions, patterns, or sequences including those represented in real-world situations.
- The student demonstrates algebraic thinking.
Algebra
-
Reasoning with Equations and Inequalities
- Understand solving equations as a process of reasoning and explain the reasoning
- Represent and solve equations and inequalities graphically
-
Seeing Structure in Expressions
- Write expressions in equivalent forms to solve problems
Functions
-
Building Functions
- Build new functions from existing functions
-
Interpreting Functions
- Interpret functions that arise in applications in terms of the context
- Analyze functions using different representations
-
Linear, Quadratic, and Exponential Models
- Construct and compare linear, quadratic, and exponential models and solve problems
Geometry
-
Circles
- Understand and apply theorems about circles
-
Expressing Geometric Properties with Equations
- Translate between the geometric description and the equation for a conic section
Pre-Calculus
-
Geometry and Measurement
- Competency Goal 2: The learner will use relations and functions to solve problems.
Integrated Mathematics IV
-
Geometry and Measurement
- Competency Goal 2: The learner will describe geometric figures in the coordinate plane algebraically.
Algebra I
-
Foundation for Functions
- 1. The student understands that a function represents a dependence of one quantity on another and can be described in a variety of ways.
-
Quadratic and Other Nonlinear Functions
- 9. The student understands that the graphs of quadratic functions are affected by the parameters of the function and can interpret and describe the effects of changes in the parameters of quadratic functions.
- 11. The student understands there are situations modeled by functions that are neither linear nor quadratic and models the situations.
Secondary
-
Mathematical Analysis
- MA.08 The student will investigate and identify the characteristics of conic section equations in (h, k) and standard forms. The techniques of translation and rotation of axes in the coordinate plane will be used to graph conic sections.
Be Prepared to
- answer the question "Which is the x-axis and which is the y-axis?"
- generalize the effects of changing the constants or coefficients in the type of conic section thestudents are studying