What is Slope Slider?
This activity allows the user to explore the relationship between slope and intercept in the Cartesian coordinate system.
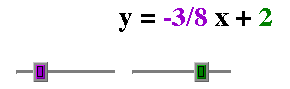
The applet allows the manipulation of a linear function. The user may view the function in two forms: slope-intercept form, f(x) = mx + b, or standard notation, ax + by = c. There is a slider to change each coefficient and constant, so the user can manipulate the line and a point along the line.
How Do I Use This Activity?
This activity allows the user to use various controls to manipulate a linear function graphically.
Controls and Output
-
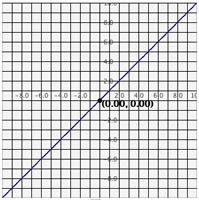
There is a graph at the top of the activity. Below the graph are various slider bars.
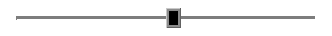
Moving the black slider bar left or right with the mouse permits the user to change the
location of the point along the line.
-
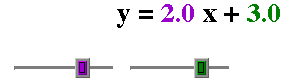
When the equation of the line is in slope-intercept form, the purple slider allows the
user to manipulate the slope of the line. The green slider allows the user to manipulate
the y-intercept of the line. Note how the function and the graph change when you
manipulate the slope and y-intercept sliders.
-
You can also view the equation in
Standard Notation by checking the Standard Notation checkbox.
-
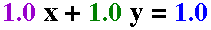
Doing so will enable a third slider bar. The purple and green sliders affect the slope of
the line. The green and blue sliders affect the y-intercept of the line. The purple and
blue sliders affect the x-intercept of the line. Note how the line changes when you
manipulate these sliders compared to when the line is in slope-intercept form.
-
While in standard notation (Ax+By=C), if A=0 and B=0, the black slider bar will be
disabled and the graph will be empty because the equation is unsolvable for all values of
C. Given A=0, B=0, and C=0, all values of x and y satisfy the equation so there is no
unique solution. Given A=0, B=0, and C≠0, no values of x and y satisfy the equation so
there is no solution.
-
While in standard notation (Ax+By=C), if B=0, A≠0, and C≠0, the black slider bar
will be disabled, but a vertical line will still appear on the graph. Given these
parameters, the purple and blue sliders will only affect the x-intercept of the line since
it is vertical.
-
The
Link Sliders check box, when activated, allows the user to move both sliders simultaneously provided
both sliders may be moved in the direction of the dragged slider. For example, if
Link Sliders is checked and the purple slider is moved five units to the right, the green slider will
also move five units to the right provided there is space for the green slider to do so.
-
The
Show Trace check box, when activated, allows the user to see the various intermediate stages as the
line changes in response to changes in the slider bars.

- By clicking the Clear Trace button, the user can clear the traces that are left on the graph after using the Show Trace feature.
-
The two radio buttons on the bottom of the activity control whether decimals or fractions
are used for the numbers. For instance, if you select
Use Decimals, one tenth will be represented as 0.1. If you select
Use Fractions, one tenth will be represented as 1/10.

-
The
Slider Settings button brings up a dialog box that allows you to set the minimum and maximum values of
each slider bar. You can also set the step size for each slider bar. The step size
controls the size of the increment for the values on a slider bar. For instance, if you
set the minimum to 0, the maximum to 1, and the step to 0.1, the slider will increment the
value of the constant at the intervals of 0, 0.1, 0.2, etc. However, if you set the step
to 0.2, the slider will stop at 0, 0.2, 0.4, etc. The input will always be rounded to the
nearest tenth when using decimal values.
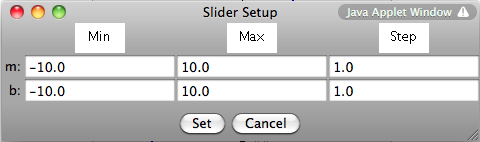
The number of increments must be smaller than 100. If you enter parameters such that the number of steps is greater than 100 then an error message appears asking you to readjust by setting the slider min, slider max, or step size.
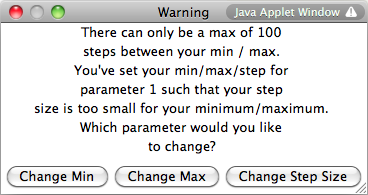
For example, suppose you are using fractions and you want a step size of 1/8 for m. The default min/max of -10 to 10 with a step size of 1/8 would result in 160 steps which would generate the Warning window. Suppose you select change min. The new Slider Setup would calculate an appropriate min (reduced to lowest terms) that would allow 100 steps of size 1/8 between the new min and the original max. The appropriate slider would be recalibrated and the values of m would appear as fractions reduced to lowest terms.
-
There are three types of grids:
No Grid,
Light Grid Lines, and
Dark Grid Lines. To activate any of these three options, highlight the circle next to the appropriate
option:
No Grid graph: Light Grid Line graph: Dark Grid Grid Line graph: 
-
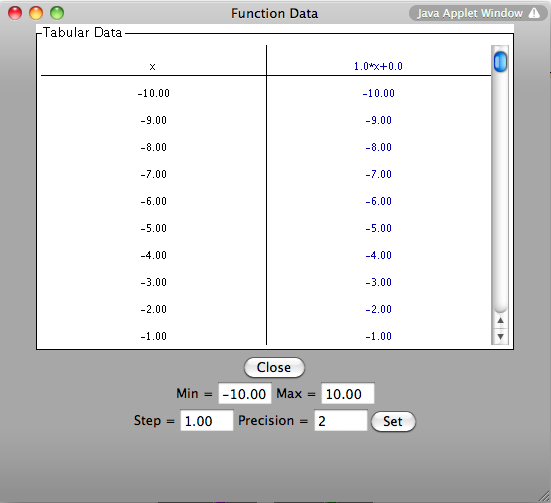
To view a table of values corresponding to the graphed function, click the
Show Tabular Data button.
-
The x values in the table increment equally and then give the corresponding f(x) values
for the function. You can change these data values by entering a new minimum x value, new
maximum x value, and step size. If you enter a step that does not divide evenly into the
range, the table will stop at the greatest multiple of the step that is less than the
maximum. The precision field allows you to adjust the number of decimal points to print
out values of x and f(x).
Description
This activity allows the user to experiment with slope and y-intercept. This activity would work well in groups of two to four for about thirty to forty-five minutes if you use the exploration questions and fifteen to twenty minutes otherwise.
Place in Mathematics Curriculum
This activity can be used to:
- introduce slope-intercept form of a line
- introduce slope and y-intercept
Standards Addressed
Grade 9
-
Functions and Relationships
- The student demonstrates conceptual understanding of functions, patterns, or sequences including those represented in real-world situations.
- The student demonstrates algebraic thinking.
Grade 10
-
Functions and Relationships
- The student demonstrates conceptual understanding of functions, patterns, or sequences including those represented in real-world situations.
- The student demonstrates algebraic thinking.
Eighth Grade
-
Expressions and Equations
- Understand the connections between proportional relationships, lines, and linear equations.
- Analyze and solve linear equations and pairs of simultaneous linear equations.
-
Functions
- Define, evaluate, and compare functions.
- Use functions to model relationships between quantities.
Algebra
-
Seeing Structure in Expressions
- Interpret the structure of expressions
Functions
-
Building Functions
- Build new functions from existing functions
-
Interpreting Functions
- Interpret functions that arise in applications in terms of the context
- Analyze functions using different representations
-
Linear, Quadratic, and Exponential Models
- Construct and compare linear, quadratic, and exponential models and solve problems
Grades 6-8
-
Algebra
- Analyze change in various contexts
- Represent and analyze mathematical situations and structures using algebraic symbols
Grades 9-12
-
Algebra
- Analyze change in various contexts
- Represent and analyze mathematical situations and structures using algebraic symbols
- Understand patterns, relations, and functions
- Use mathematical models to represent and understand quantitative relationships
Grade 7
-
Number and Operations, Measurement, Geometry, Data Analysis and Probability, Algebra
- COMPETENCY GOAL 5: The learner will demonstrate an understanding of linear relations and fundamental algebraic concepts.
Grade 8
-
Number and Operations, Measurement, Geometry, Data Analysis and Probability, Algebra
- COMPETENCY GOAL 5: The learner will understand and use linear relations and functions.
Introductory Mathematics
-
Algebra
- COMPETENCY GOAL 4: The learner will understand and use linear relations and functions.
- COMPETENCY GOAL 5: The learner will understand and use linear relations and functions.
Algebra II
-
Algebra
- Competency Goal 2: The learner will use relations and functions to solve problems.
Integrated Mathematics III
-
Algebra
- Competency Goal 3: The learner will use relations and functions to solve problems.
Integrated Mathematics IV
-
Algebra
- Competency Goal 4: The learner will use relations and functions to solve problems.
3rd Grade
-
Algebra
- The student will demonstrate through the mathematical processes an understanding of numeric patterns, symbols as representations of unknown quantity, and situations showing increase over time.
5th Grade
-
Algebra
- The student will demonstrate through the mathematical processes an understanding of the use of patterns, relations, functions, models, structures, and algebraic symbols to represent quantitative relationships and will analyze change in various contexts.
4th Grade
-
Algebra
- Standard 4-3: The student will demonstrate through the mathematical processes an understanding of numeric and nonnumeric patterns, the representation of simple mathematical relationships, and the application of procedures to find the value of an unknown.
7th Grade
-
Algebra
- The student will demonstrate through the mathematical processes an understanding of proportional relationships.
8th Grade
-
Algebra
- The student will demonstrate through the mathematical processes an understanding of equations, inequalities, and linear functions.
Elementary Algebra
-
Elementary Algebra
- Standard EA-1: The student will understand and utilize the mathematical processes of problem solving, reasoning and proof, communication, connections, and representation.
- Standard EA-4: The student will demonstrate through the mathematical processes an understanding of the procedures for writing and solving linear equations and inequalities.
- Standard EA-5: The student will demonstrate through the mathematical processes an understanding of the graphs and characteristics of linear equations and inequalities.
Algebra I
-
Linear Functions
- 6. The student understands the meaning of the slope and intercepts of the graphs of linear functions and zeros of linear functions and interprets and describes the effects of changes in parameters of linear functions in real-world and mathematical situations.
8th Grade
-
Patterns, Functions, and Algebra
- 8.14a The student will describe and represent relations and functions, using tables, graphs, and rules; and
- 8.14 The student will
Secondary
-
Algebra II
- AII.09 The student will find the domain, range, zeros, and inverse of a function; the value of a function for a given element in its domain; and the composition of multiple functions. Functions will include exponential, logarithmic, and those that have domains and ranges that are limited and/or discontinuous. The graphing calculator will be used as a tool to assist in investigation of functions.
- AII.10 The student will investigate and describe through the use of graphs the relationships between the solution of an equation, zero of a function, x-intercept of a graph, and factors of a polynomial expression.
- AII.12 The student will represent problem situations with a system of linear equations and solve the system, using the inverse matrix method. Graphing calculators or computer programs with matrix capability will be used to perform computations.
- AII.13 The student will solve practical problems, using systems of linear inequalities and linear programming, and describe the results both orally and in writing. A graphing calculator will be used to facilitate solutions to linear programming problems.
- AII.15 The student will recognize the general shape of polynomial, exponential, and logarithmic functions. The graphing calculator will be used as a tool to investigate the shape and behavior of these functions.
- AII.9
- AII.10
- AII.12
- AII.13
- AII.15
Textbooks Aligned
Grade Seven
-
Moving Straight Ahead
- Investigation Three: Exploring Lines with a Graphing Calculator
- Investigation Five: Exploring Slope
Grade Eight
-
Looking for Pythagoras
- Investigation One: Locating Points
- Investigation Six: Rational and Irrational Slopes
8th
-
Module 4 - Inventions
- Section 3: Slopes and Equations of Lines
Book 2
-
The Language of Algebra
- Lesson 6: The Algebra Walk
Book 3
-
Family Portraits
- Lesson 4: A New Slant on Linear Functions
- Lesson 5: What's in an Equation?
- Lesson 6: The Shortest Distance Between Two Points...
Grade 8
-
Get the Most Out of It
- Graphing Lines
-
Graphing Equations
- Graphing Points and Lines
- Solving Linear Equations
- Equation of a line
-
Growth
- Linear functions
- Growth
Grade 5
-
Figuring All the Angles
- Rectangular Coordinates
-
Picturing Numbers
- Line Graphs
- Using Data for Arguments
Grade 6
-
Dealing With Data
- Scatter Plots
-
Operations
- Coordinate Plane
-
Tracking Graphs
- Line Graphs
- Interpreting Graphs
- Looking at a Graph's global features
Grade 7
-
Ups and Downs
- Increasing and Decreasing Functions
- Linear Functions
Be Prepared to
- answer the question "Which is the x-axis and which is the y-axis?"
- discuss slope, intercepts, and functions