What is Graphit?
This activity allows the user to plot ordered pairs and algebraic functions on the same coordinate plane. It combines the capabilities of Simple Plot and Graph Sketcher ( See the Learner tab for additional information).
The Cartesian coordinate system was formalized by Rene Descartes in the 17th century to help visualize functions via plotting function values as ordered pairs. In this system a grid of evenly spaced horizontal and vertical lines is drawn, a center or "origin" is chosen, and horizontal and vertical scales are chosen. Here's an example:
Another name for the horizontal movement value is the abscissa, and the vertical movement is the ordinate. These terms are more rare now than they used to be, but you might still hear them being used.
How Do I Use This Activity?
This activity allows the user to plot ordered pairs and algebraic functions on the same coordinate plane. It combines the capabilities of Simple Plot and Graph Sketcher.
Controls and Output
-
The area at the top of the screen is where the plot is displayed.
-
The Function area is for entering functions. To graph a function, type the formula of the function you want to graph in the space at the bottom of the applet, next to y(x)=. You may graph up to nine functions on the same plot. Enter one formula per line, as shown.
Basic functions and their compositions can be typed as follows:
Function Symbol Examples (including combinations of functions) addition + x + 3 x plus three subtraction - 5 - x five minus x multiplication * (x - 2)*x x times x minus two division / 3/x three divided by x power ^ x^3 - 1 x to the power of three minus one power ** x**3 - 1 x to the power of three minus one (pi) pi sin(pi*x) sin of (pi) times x square root sqrt(...) sqrt(x-1) square root of x minus one nth root
(see * below)
x^(1/n) x^(1/3) cube root of x absolute value abs(...) abs(3 - x) absolute value of three minus x e to the power of x exp(...) exp(x) e to the power of x sine sin(...) sin(x**2) sine of x squared cosine cos(...) cos(5 - x) cosine of five minus x tangent tan(...) tan(x) tangent x arcsine asin(...) 2*asin(x) two times arcsine x arccosine acos(...) acos(x) arccosine x arctangent atan(...) atan(x) arctangent of x hyperbolic sine sinh(...) sinh(1 - x) hyperbolic sine of one minus x hyperbolic cosine cosh(...) cosh(10/x) hyperbolic cosine of ten divided by x hyperbolic tangent tanh(...) tanh(x) hyperbolic tangent of x natural logarithm ln(...) ln(x) natural logarithm of x base 10 logarithm log(...) log(x + 5) base ten logarithm of x plus five - The Data area is for entering data points. Data points should be in the form (x, y). Parentheses around the data point are optional. A tab or a space can separate the x and the y though no space is needed. A space or a carriage return is required to separate the data points from one another. After you input the coordinates, you must press the Plot/Update button to graph them.
- If you have trouble copying data from the applet and pasting it into an Excel spreadsheet, please see our Excel Copy/Paste Help.
- You can plot a total of nine functions at once. You can also plot a total of twelve data sets at once. Separate each function with a comma. Separate data sets by typing newgraph on a line by itself in the Data window. If you want to specify your own colors for the graphs you can replace newgraph with the following keywords: bluegraph, redgraph, greengraph, blackgraph, graygraph, magentagraph, browngraph, orangegraph, purplegraph, crimsongraph, darkbluegraph.
-
You can choose from two
plot types. "Connected" draws a line from one point to the next (before the line is drawn the points
are sorted by their x coordinates.) "Scatter Plot" just draws the points as dots on the
graph. These options do not affect the way functions are graphed.

-
Click
Set Window to determine how the coordinate plane will appear on your screen. A new window will open
that allows you to change the setttings. X min and X max are the minimum and maximum
x-values displayed on the graph. Similarly for Y min and Y max. X scale is the distance
between vertical gridlines if
Choose Scale Automatically is checked. Y scale is the distance between horizontal gridlines if
Choose Scale Automatically is checked. If the
Use Defaults box is unchecked, Graphit will choose appropriate values for you. If you uncheck that
box, you can override Graphit's values with your own. If you wish to revert back to the
default values, click
Get Defaults in the Set Window box. Click
Set to make the changes to the window parameters take effect.
-
You can choose what you see on the graph. You can select to show all functions, all data,
and/or the grid lines by checking the appropriate box or radio button in the
Show box.
-
The applet also can tell you the location of any click. Just click the mouse anywhere on
the graph that you want to know the coordinates of and the coordinates will appear in the
Mouse Pos. box.

-
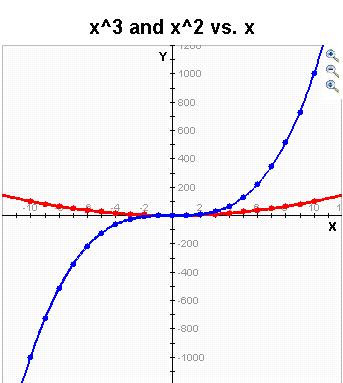
Zoom/Pan buttons. In the upper right corner of the graph, there are three buttons with pictures of
magnifying glasses. From top to bottom these buttons represent zoom in, zoom out, and pan,
respectively.
-
To zoom in, click the top button to depress, then click and drag over the area of the
graph for which you wish to zoom to. Note that after clicking and dragging over the
selected area, the zoom in button is automatically released.
 _
_
- To zoom out, simply click the middle button. The graph will automatically zoom out by doubling the min and max values of the axes.
- To use the pan feature, click the bottom magnifying glass button to depress it. Click and drag over the graph and the graph will pan around according to the movement of the mouse. Upon releasing the mouse, the pan button is released.
- Auto Scale: Checking the Auto Scale check box gives the smallest window possible so that all of the data points still fit on the coordinate plane. Note that there must be data for this feature to work.

-
To zoom in, click the top button to depress, then click and drag over the area of the
graph for which you wish to zoom to. Note that after clicking and dragging over the
selected area, the zoom in button is automatically released.
-
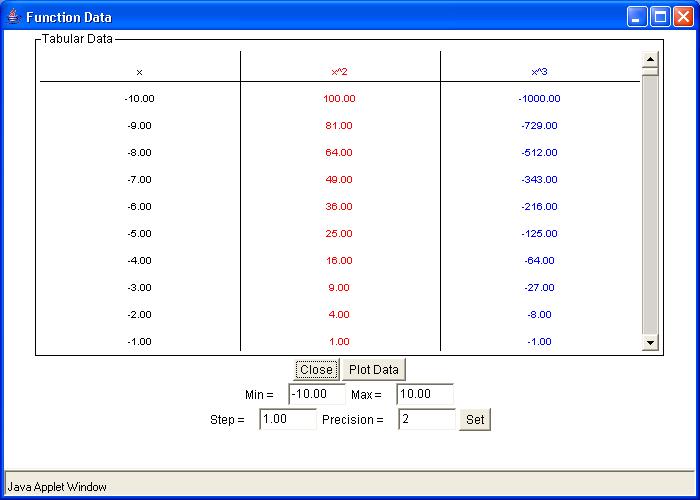
To view a table of values corresponding to the graphed function, click the
Show Tabular Data button.
-
The x values in the table increment equally and then give the corresponding f(x) values
for each function plotted. You can change these data values by entering a new minimum x
value, new maximum x value, and step size. If you enter a step that does not divide evenly
into the range, the table will stop at the greatest multiple of the step that is less than
the maximum. The precision field allows you to adjust the number of decimal points
displayed.
-
When the
Plot Data button within the Show Tabular Data window is pressed, the data listed in tabular form in
the Tabular Data window is plotted on the graph of the main screen.
Description
This activity allows the user to plot ordered pairs and algebraic functions on the same coordinate plane. It combines the capabilities of Simple Plot and Graph Sketcher. This activity would work well in groups of two to four for about forty-five minutes if you use the exploration questions and twenty minutes otherwise.
Place in Mathematics Curriculum
This activity can be used to:
- illustrate the Cartesian coordinate system
- practice students' pattern recognitions skills
- practice students' graph reading skills
- illustrate the relationship between graphical and algebraic representations of functions
Standards Addressed
Grade 6
-
Algebra and Functions
- 1.0 Students write verbal expressions and sentences as algebraic expressions and equations; they evaluate algebraic expressions, solve simple linear equations, and graph and interpret their results
Grade 7
-
Algebra and Functions
- 1.0 Students express quantitative relationships by using algebraic terminology, expressions, equations, inequalities, and graphs
- 3.0 Students graph and interpret linear and some nonlinear functions
- 4.0 Students solve simple linear equations and inequalities over the rational numbers
Grades 8-12
-
Algebra I
- 17.0 Students determine the domain of independent variables and the range of dependent variables defined by a graph, a set of ordered pairs, or a symbolic expression.
- 21.0 Students graph quadratic functions and know that their roots are the x-intercepts.
-
Algebra II
- 9.0 Students demonstrate and explain the effect that changing a coefficient has on the graph of quadratic functions; that is, students can determine how the graph of a parabola changes as a, b, and c vary in the equation y = a(x-b)2 + c.
- 17.0 Given a quadratic equation of the form ax2 + by2 + cx + dy + e = 0, students can use the method for completing the square to put the equation into standard form and can recognize whether the graph of the equation is a circle, ellipse, parabola, or hyperbola. Students can then graph the equation.
-
Trigonometry
- 2.0 Students know the definition of sine and cosine as y-and x-coordinates of points on the unit circle and are familiar with the graphs of the sine and cosine functions.
Fifth Grade
-
Geometry
- Graph points on the coordinate plane to solve real-world and mathematical problems.
Eighth Grade
-
Statistics and Probability
- Investigate patterns of association in bivariate data.
Algebra
-
Creating Equations
- Create equations that describe numbers or relationships
-
Reasoning with Equations and Inequalities
- Solve systems of equations
- Represent and solve equations and inequalities graphically
Functions
-
Building Functions
- Build new functions from existing functions
-
Interpreting Functions
- Understand the concept of a function and use function notation
- Interpret functions that arise in applications in terms of the context
- Analyze functions using different representations
-
Linear, Quadratic, and Exponential Models
- Construct and compare linear, quadratic, and exponential models and solve problems
- Interpret expressions for functions in terms of the situation they model
-
Trigonometric Functions
- Model periodic phenomena with trigonometric functions
Grades 3-5
-
Algebra
- Represent and analyze mathematical situations and structures using algebraic symbols
Grades 6-8
-
Algebra
- Analyze change in various contexts
- Represent and analyze mathematical situations and structures using algebraic symbols
- Understand patterns, relations, and functions
- Use mathematical models to represent and understand quantitative relationships
Grades 9-12
-
Algebra
- Analyze change in various contexts
- Represent and analyze mathematical situations and structures using algebraic symbols
- Understand patterns, relations, and functions
- Use mathematical models to represent and understand quantitative relationships
Grade 6
-
Number and Operations, Measurement, Geometry, Data Analysis and Probability, Algebra
- COMPETENCY GOAL 5: The learner will demonstrate an understanding of simple algebraic expressions.
Grade 7
-
Number and Operations, Measurement, Geometry, Data Analysis and Probability, Algebra
- COMPETENCY GOAL 5: The learner will demonstrate an understanding of linear relations and fundamental algebraic concepts.
Grade 8
-
Number and Operations, Measurement, Geometry, Data Analysis and Probability, Algebra
- COMPETENCY GOAL 5: The learner will understand and use linear relations and functions.
Introductory Mathematics
-
Algebra
- COMPETENCY GOAL 4: The learner will understand and use linear relations and functions.
- COMPETENCY GOAL 5: The learner will understand and use linear relations and functions.
Algebra I
-
Algebra
- Competency Goal 4: The learner will use relations and functions to solve problems.
Algebra II
-
Algebra
- Competency Goal 2: The learner will use relations and functions to solve problems.
Technical Mathematics II
-
Data Analysis and Probability
- Competency Goal 2: The learner will use relations and functions to solve problems.
Pre-Calculus
-
Geometry and Measurement
- Competency Goal 2: The learner will use relations and functions to solve problems.
Integrated Mathematics
-
Algebra
- Competency Goal 4: The learner will use relations and functions to solve problems.
-
Data Analysis and Probability
- Competency Goal 3: The learner will analyze data and apply probability concepts to solve problems.
Integrated Mathematics II
-
Algebra
- Competency Goal 4: The learner will use relations and functions to solve problems.
-
Data Analysis and Probability
- Competency Goal 3: The learner will collect, organize, and interpret data to solve problems.
Integrated Mathematics III
-
Algebra
- Competency Goal 3: The learner will use relations and functions to solve problems.
Integrated Mathematics IV
-
Algebra
- Competency Goal 4: The learner will use relations and functions to solve problems.
AP Calculus
-
Numbers and Operations
- Competency Goal 1: The learner will demonstrate an understanding of the behavior of functions.
8th Grade
-
Algebra
- The student will demonstrate through the mathematical processes an understanding of equations, inequalities, and linear functions.
Elementary Algebra
-
Elementary Algebra
- Standard EA-5: The student will demonstrate through the mathematical processes an understanding of the graphs and characteristics of linear equations and inequalities.
Intermediate Algebra
-
Algebra
- The student will demonstrate through the mathematical processes an understanding of algebraic expressions and nonlinear functions.
7th Grade
-
Algebra
- The student will understand and generalize patterns as they represent and analyze quantitative relationships and change in a variety of contexts and problems using graphs, tables, and equations.
8th Grade
-
Algebra
- The student will understand and generalize patterns as they represent and analyze quantitative relationships and change in a variety of contexts and problems using graphs, tables, and equations.
Algebra I
-
Algebra
- Students will describe, extend, analyze, and create a wide variety of patterns and functions using appropriate materials and representations in real world problem solving.
-
Numbers and Operations
- Students will recognize, represent, model, and apply real numbers and operations verbally, physically, symbolically, and graphically.
Algebra II
-
Algebra
- Students will describe, extend, analyze, and create a wide variety of patterns and functions using appropriate materials and representations in real-world problem solving, and will demonstrate an understanding of the behavior of a variety of functions and their graphs.
Pre-Calculus
-
Algebraic Functions
- Students will extend the concepts of function from earlier courses to a wider variety of functions and their graphs and real-world applications.
-
Models for Real-World Phenomena
- Students will model and analyze real-world phenomena using techniques from algebra and data analysis.
-
Trigonometric Functions
- Students will develop the concept of trigonometry.
Grade 8
-
Patterns, Relationships, and Algebraic Thinking
- 5. The student uses graphs, tables, and algebraic representations to make predictions and solve problems.
Algebra I
-
Foundation for Functions
- 1. The student understands that a function represents a dependence of one quantity on another and can be described in a variety of ways.
-
Linear Functions
- 5. The student understands that linear functions can be represented in different ways and translates among their various representations.
- 6. The student understands the meaning of the slope and intercepts of the graphs of linear functions and zeros of linear functions and interprets and describes the effects of changes in parameters of linear functions in real-world and mathematical situations.
-
Quadratic and Other Nonlinear Functions
- 9. The student understands that the graphs of quadratic functions are affected by the parameters of the function and can interpret and describe the effects of changes in the parameters of quadratic functions.
- 11. The student understands there are situations modeled by functions that are neither linear nor quadratic and models the situations.
Algebra II
-
Quadratic and Square Root Functions
- 7. The student interprets and describes the effects of changes in the parameters of quadratic functions in applied and mathematical situations.
Mathematical Models with Applications
-
Knowledge and Skills
- 2. The student uses graphical and numerical techniques to study patterns and analyze data.
7th Grade
-
Patterns, Functions, and Algebra
- 7.19 The student will represent, analyze, and generalize a variety of patterns, including arithmetic sequences and geometric sequences, with tables, graphs, rules, and words in order to investigate and describe functional relationships.
8th Grade
-
Patterns, Functions, and Algebra
- 8.14a The student will describe and represent relations and functions, using tables, graphs, and rules; and
- 8.16 The student will graph a linear equation in two variables, in the coordinate plane, using a table of ordered pairs.
- 8.14b relate and compare tables, graphs, and rules as different forms of representation for relationships.
Secondary
-
Algebra I
- A.01 The student will solve multistep linear equations and inequalities in one variable, solve literal equations (formulas) for a given variable, and apply these skills to solve practical problems. Graphing calculators will be used to confirm algebraic solutions.
- A.07 The student will determine the slope of a line when given an equation of the line, the graph of the line, or two points on the line. Slope will be described as rate of change and will be positive, negative, zero, or undefined. The graphing calculator will be used to investigate the effect of changes in the slope on the graph of the line.
- A.08 The student will write an equation of a line when given the graph of the line, two points on the line, or the slope and a point on the line.
-
Algebra II
- AII.14 The student will solve nonlinear systems of equations, including linear-quadratic and quadratic-quadratic, algebraically and graphically. The graphing calculator will be used as a tool to visualize graphs and predict the number of solutions.
- AII.15 The student will recognize the general shape of polynomial, exponential, and logarithmic functions. The graphing calculator will be used as a tool to investigate the shape and behavior of these functions.
-
Algebra II and Trigonometry
- AII/T.14 The student will solve nonlinear systems of equations, including linear-quadratic and quadratic-quadratic, algebraically and graphically. The graphing calculator will be used as a tool to visualize graphs and predict the number of solutions.
- AII/T.15 The student will recognize the general shape of polynomial, exponential, and logarithmic functions. The graphing calculator will be used as a tool to investigate the shape and behavior of these functions.
- AII/T.26 The student, given one of the six trigonometric functions in standard form [e.g., y = A sin (Bx + C) + D, where A, B, C, and D are real numbers], will state the domain and the range of the function; determine the amplitude, period, phase shift, and vertical shift; and, sketch the graph of the function by using transformations for at least a one-period interval. The graphing calculator will be used to investigate the effect of changing A, B, C, and D on the graph of a trigonometric function.
-
Trigonometry
- T.06 The student, given one of the six trigonometric functions in standard form [e.g., y = A sin (Bx + C) + D, where A, B, C, and D are real numbers], will state the domain and the range of the function; determine the amplitude, period, phase shift, and vertical shift; and sketch the graph of the function by using transformations for at least a one-period interval. The graphing calculator will be used to investigate the effect of changing A, B, C, and D on the graph of a trigonometric function.
Textbooks Aligned
Grade Seven
-
Moving Straight Ahead
- Investigation Three: Exploring Lines with a Graphing Calculator
- Investigation Five: Exploring Slope
- Investigation Six: Writing an Equation for a Line
-
Variables and Patterns
- Investigation Four: Patterns and Rules
- Investigation Five: Using a Graphing Calculator
Grade Eight
-
Frogs, Fleas and Painted Cubes
- Investigation One: Introduction to Quadratic Relationships
- Investigation Two: Quadratic Expressions
- Investigation Three: Quadratic Patterns of Change
- Investigation Four: What Is a Quadratic Function?
- Investigation Five: Painted Cubes
-
Growing, Growing, Growing
- Investigation One: Exponential Growth
- Investigation Two: Growth Patterns
- Investigation Three: Growth Factors
- Investigation Four: Exponential Decay
-
Say It with Symbols
- Investigation Four: Solving Equations
-
Thinking with Mathematical Models
- Investigation One: Linear Models
- Investigation Two: Nonlinear Models
- Investigation Three: More Nonlinear Models
- Investigation Four: A World of Patterns
Book 1
-
Module 4 - Mind Games
- Section 5: Graphing on the Coordinate Grid
- Section 5: Expressions and Equations Multiples
-
Module 6 - Comparisons and Predictions
- Section 3: Using Ratios
-
Module 8 - Our Environment
- Section 2: Representing Population Data
Book 2
-
Module 2 - Search and Rescue
- Section 2: Coordinate Graphing of Integers
- Section 4: Modeling Functions
- Section 4: Graphing Functions
-
Module 5 - Recreation
- Section 2: Scatter Plots
-
Module 7 - Health and Wellness
- Section 1: Volume of a Cylinder
- Section 1: Formulas and Graphs
- Section 1: Misleading Graphs
Book 3
-
Module 2 - At the Mall
- Section 1: Percent
-
Module 3 - The Mystery of Blacktail Canyon
- Section 2: Order of Operations
- Section 2: Graphing Equations
- Section 3: Slopes
-
Module 7 - Visualizing Change
- Section 1: Modeling Change
- Section 1: Functions
- Section 5: Parabolas
- Section 5: Quadratic Equations
7th
-
Module 1 - Search and Rescue
- Section 4: Function Models
-
Module 2 - Bright Ideas
- Section 2: Interpreting Graphs
8th
-
Module 3 - The Mystery of Blacktail Canyon
- Section 2: Equations and Graphs
- Section 3: Slope and Equations
-
Module 6 - Visualizing Change
- Section 1: Graphs and Functions
- Section 3: Modeling Exponential Change
- Section 5: Exploring Quadratic Functions
Book 2
-
The Language of Algebra
- Lesson 6: The Algebra Walk
- Lesson 7: Putting It All Together
Book 3
-
Family Portraits
- Lesson 2: Keeping a Steady Pace
- Lesson 3: How Long Is a Meter
- Lesson 5: What's in an Equation?
Grade 8
-
Get the Most Out of It
- Word Problems with Two Unknowns
- Systems of Equations
- Graphing Lines
- Graphing Inequalities
- Graphing Hyperbolas
-
Graphing Equations
- Graphing Points and Lines
- Solving Linear Equations
- Graphing Inequalities
- Equation of a line
-
Growth
- Linear functions
- Quadratic Functions
- Cubic Functions
- Exponential Functions
- Sequences
- Growth
Grade 5
-
Figuring All the Angles
- Measuring Angles
- Vectors
- Rectangular Coordinates
- Polar Coordinates
-
Patterns and Symbols
- Variables
- Patterns
- Pattern Rule
-
Picturing Numbers
- Bar Graphs
- Line Graphs
- Pie Charts
- Pictographs
- Describing Data
- Using Data for Arguments
Grade 6
-
Dealing With Data
- Scatter Plots
- Box Plots
- Stem and Leaf Plot
- Histograms
- Mean, Median, Mode and Range
-
Operations
- Operations with Integers
- Plotting Points
- Coordinate Plane
-
Tracking Graphs
- Line Graphs
- Interpreting Graphs
- Looking at a Graph's global features
Grade 7
-
Packages and Polygons
- Geometric Shapes
- Models
- Properties of Regular and Semi-Regular Polyhedra
-
Ups and Downs
- Increasing and Decreasing Functions
- Linear Functions
- Periodic Functions
Be Prepared to
- answer the question "How do you fit a line to a set of data?"
- discuss the concepts of trend lines, slope, and the y-intercept