What is InteGreat!?
This activity allows students to learn about the integral of a function and the many techniques that exist to approximate its value. Students have the option to choose an integration technique, small-number addition error, partition size and number, and range of integration. They can then view a graph of the function along with the value of the integral.
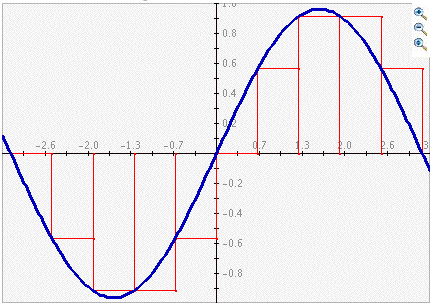
The integral is typically used when dealing with the problem of area where the shape of the region is difficult to deal with. Area is very easy to calculate when you have straight edges, such as with rectangles and triangles. However, it is not so easy to find the area of a region with curved sides. To deal with this problem, we use rectangles and other polygons to approximate the shape of the curve. We can then find the area of these simple shapes and use it to approximate the area of the curved region. We get better and better approximations as we increase the number of polygons used.
How Do I Use This Activity?
This activity allows the user to approximate the value of the integral of a function using Riemann's sums. The user can then change the range of integration, step size, and number of steps to see how these affect the approximation of the integral.
Controls and Output
The area at the bottom of the screen is where the plot is displayed:
-
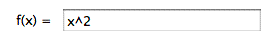
Function: The user can enter a function in the text box next to the "f (x) = ".
-
Integration Range: The user can enter the range in which they want to integrate over. This
can be done in the text boxes next to the text "Integrate from x = " and "to x".

-
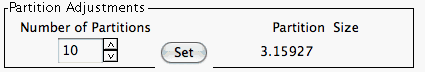
Partitions: The user can change the number of partitions used in calculating the integral.
This can be done by either clicking the arrows (which updates graphically automatically)
or entering a value manually (which requires pressing the Set button). The size of each
partition depends upon the upper and lower limits of the integral; the size is calculated
and displayed after pressing the arrows or the Set button.
-
Integration Technique: The user must also choose which technique to use in calculating the
integral. The user can experiment with all the different methods and compare accuracies.

-
To view a table of values corresponding to the graphed function, click the
Show Tabular Data button.
-
The x values in the table increment equally and then give the corresponding f(x) values
for the function. You can change these data values by entering a new minimum or maximum x
value, step size, or precision. If you enter a step size that does not divide evenly into
the range, the table will stop at the greatest multiple of the step that is less than the
maximum.

- In the upper right corner of the graph, there are three buttons with pictures of magnifying glasses. From top to bottom these buttons represent zoom in, zoom out, and pan, respectively.
-
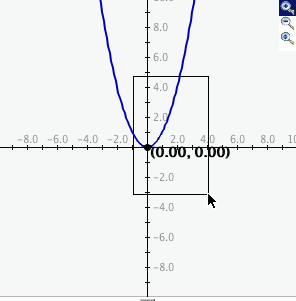
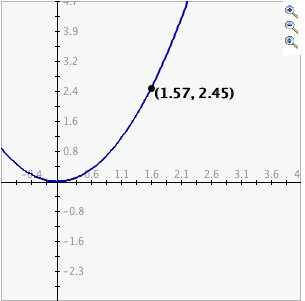
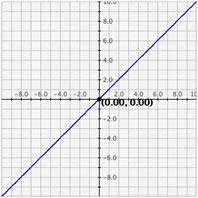
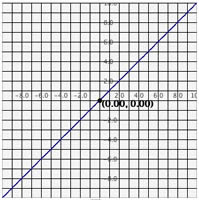
To zoom in, click the top button to depress it, then click and drag over the area of the
graph that you wish to magnify. The images below show first the process of dragging a box
around a desired zoom area with the mouse (left), and then the resulting zoomed image
after the mouse button is released (right). Note that after the zoom-in has been
performed, the zoom-in button at top right is no longer depressed.
- To zoom out, simply click the middle button. The graph will automatically zoom out by doubling the min and max values of the axes.
- To use the pan feature, click the bottom magnifying glass button to depress it. Click and drag over the graph and the graph will pan around according to the movement of the mouse. Upon releasing the mouse, the pan button is released.
-
There are three types of grids: No Grid, Light Grid Lines, and Dark Grid Lines. To activate any of these three options, highlight the circle next to the appropriate option:
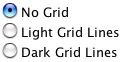
No Grid graph: Light Grid Lines graph: Dark Grid Lines graph: 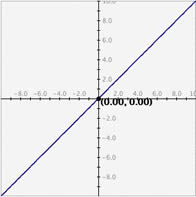
-
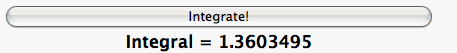
To calculate the integral the user must click on the
Integrate! button. The graph will then update with all your data, and the value of the integral
will be displayed.
Description
This activity allows the user to explore the meaning of an integral and how it can be approximated using different Riemann's sums. The user can adjust various settings and see how this affects the value of the integral.
Place in Mathematics Curriculum
This activity can be used to:
- learn about different integration techniques
- experiment with computational error
Standards Addressed
Grades 9-12
-
Algebra
- Represent and analyze mathematical situations and structures using algebraic symbols
-
Geometry
- Use visualization, spatial reasoning, and geometric modeling to solve problems
-
Measurement
- Apply appropriate techniques, tools, and formulas to determine measurements
AP Calculus
-
Data Analysis and Probability
- Competency Goal 3: The learner will use integrals to solve problems.
Algebra I
-
Quadratic and Other Nonlinear Functions
- 9. The student understands that the graphs of quadratic functions are affected by the parameters of the function and can interpret and describe the effects of changes in the parameters of quadratic functions.
- 10. The student understands there is more than one way to solve a quadratic equation and solves them using appropriate methods.
Be Prepared to
- Explain what an integral is
- Explain the different integration techniques
- Explain Small-Number Addition Error
- Explain how the integral is related to area