What is Derivate?
This activity allows the user to graph a function along with the tangent line at a particular point. The user can then use a scroll bar to slide the point along the curve. The derivative at that point is also displayed.
Trinity College closed its doors in 1665 because of the plague and sent Sir Isaac Newton home. During these next few months Newton made some of his greatest contributions to the mathematical sciences, one of which was the discovery of calculus.
Calculus quantifies motion and rates of change. The derivative in particular identifies the instantaneous rate of change. Usually when we think about speed (velocity) we define it over a period of time such as 50 miles per hour. A derivative defines that speed at a single point in time as opposed to over a period of time. Newton discovered this rate of change is simply and elegantly the slope of the line tangent to a function at that point!
The Derivate! activity helps you to see how the derivative is calculated.
How Do I Use This Activity?
This activity allows the user to develop his/her understanding of the derivative of a function, at a point on the function.
Controls and Output
- Derivate allows you to enter an algebraic function in the box below the graph. For information on the syntax of entering functions and numbers with scientific notation, see Interactivate Functions Help.
-
Enter the function you want to graph in the box and click the
Set Function button.
-
The area in the center of the screen is where the plot is displayed.
-
Once the function is graphed the blue slider controls the x-value of the point on the
graph and subsequently the line tangent to the graph at that point. The
Set Step Size input box and button changes the amount by which the slider increments. The minimum and
maximum step size are determined by the minimum and maximum x values for the window. You
can also set the x-value of the movable point by using the
Set X-Value input box and button.
-
Moving the slider moves the point along the graph and subsequently displays the line
tangent to the function at that point.
Grid Lines
-
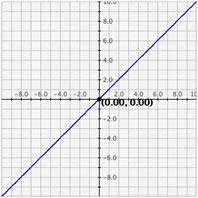
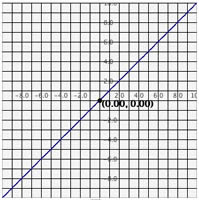
There are three types of grids:
No Grid, Light Grid Lines, and
Dark Grid Lines. To activate any of these three options, highlight the circle next to the appropriate
option:
-
No Grid graph: Light Grid Lines graph: Dark Grid Lines graph: 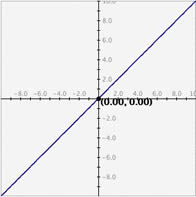
Change Scales
This Interactivate graphing activity allows two ways to alter the range on the axes.
-
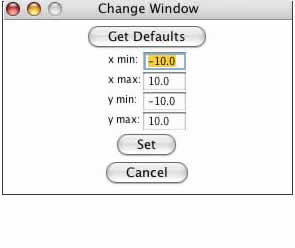
Setting exact values for axis mins/maxes: You may set the graph boundaries by clicking the
Set Window button and entering new values for the x max, x min, y max, or y min. Then click the
Set button to set the boundaries. To return the values to their defaults, you click the
Get Defaults button and then click the
Set button again. If you do not want to change the window settings you may click
Cancel.
- Zoom/Pan buttons. In the upper right corner of the graph, there are three buttons with pictures of magnifying glasses. From top to bottom these buttons represent zoom in, zoom out, and pan, respectively.
-
-
To zoom in, click the top button to select it, then click and drag over the area of
the graph that you wish to magnify. The images below show first the process of
dragging a box around a desired zoom area with the mouse (left), and then the
resulting zoomed image after the mouse button is released (right). Note that after the
zoom-in has been performed, the zoom-in button at top right is no longer selected.
- To zoom out, simply click the second of the three zoom buttons. The graph will automatically zoom out by doubling the min and max values of the axes.
- To use the pan feature, click the bottom magnifying glass button to select it. Click and drag over the graph and the graph will pan around according to the movement of the mouse. Upon releasing the mouse, the pan button is released.
-
To zoom in, click the top button to select it, then click and drag over the area of
the graph that you wish to magnify. The images below show first the process of
dragging a box around a desired zoom area with the mouse (left), and then the
resulting zoomed image after the mouse button is released (right). Note that after the
zoom-in has been performed, the zoom-in button at top right is no longer selected.
Displaying Data
-
To view a table of values corresponding to the graphed function, click the
Show Tabular Data button.
-
The x values in the table increment equally and then give the corresponding f(x) values
for the function plotted. You can change these data values by entering a new minimum x
value, new maximum x value, and step size. If you enter a step that does not divide evenly
into the range, the table will stop at the greatest multiple of the step that is less than
the maximum. The precision field allows you to adjust the number of decimal points
displayed.
-
The applet also displays the function, tangent line, and derivative and updates them as
you move the slider bar. This can be viewed below the graph.
Description
This activity allows the user to explore the meaning of a derivative and why the value of the derivative is that value. This activity would work well in small groups of one or two people for about 20-25 minutes if you use the exploration questions and 15-20 minutes otherwise.
Place in Mathematics Curriculum
This activity can be used to:
- Visualize the tangent line to a function at a point
- Relate the slope of the tangent line to the derivative
Standards Addressed
Grade 9
-
Functions and Relationships
- The student demonstrates conceptual understanding of functions, patterns, or sequences including those represented in real-world situations.
- The student demonstrates algebraic thinking.
Grade 10
-
Functions and Relationships
- The student demonstrates conceptual understanding of functions, patterns, or sequences including those represented in real-world situations.
- The student demonstrates algebraic thinking.
Functions
-
Interpreting Functions
- Understand the concept of a function and use function notation
- Interpret functions that arise in applications in terms of the context
- Analyze functions using different representations
-
Linear, Quadratic, and Exponential Models
- Interpret expressions for functions in terms of the situation they model
Grades 9-12
-
Algebra
- Analyze change in various contexts
- Understand patterns, relations, and functions
AP Calculus
-
Geometry and Measurement
- Competency Goal 2: The learner will use derivatives to solve problems.
-
Numbers and Operations
- Competency Goal 1: The learner will demonstrate an understanding of the behavior of functions.
Algebra I
-
Quadratic and Other Nonlinear Functions
- 9. The student understands that the graphs of quadratic functions are affected by the parameters of the function and can interpret and describe the effects of changes in the parameters of quadratic functions.
- 10. The student understands there is more than one way to solve a quadratic equation and solves them using appropriate methods.
Secondary
-
AP Calculus
- APC.05 The student will investigate derivatives presented in graphic, numerical, and analytic contexts and the relationship between continuity and differentiability. The derivative will be defined as the limit of the difference quotient and interpreted as an instantaneous rate of change.
- APC.06 The student will investigate the derivative at a point on a curve. This will include finding the slope of a curve at a point, including points at which the tangent is vertical and points at which there are no tangents; using local linear approximation to find the slope of a tangent line to a curve at the point; defining instantaneous rate of change as the limit of average rate of change; and, approximating rate of change from graphs and tables of values.
Be Prepared to
- Discuss the difference between an average rate and instantaneous rate
- Relate what students experience on screen to real-world examples
- Explain the controls and expected output of the activity