Abstract
This lesson uses a geometric interpretation of slope to motivate an understanding of infinity and derivatives.
Objectives
Upon completion of this lesson, students will:
- understand the geometric definition of a derivative
- understand the concepts of infinity and zero as they relate to the derivative
- be able to use the idea of limits to estimate the derivative of a function at a given point
Standards Addressed
Grade 9
-
Functions and Relationships
- The student demonstrates conceptual understanding of functions, patterns, or sequences including those represented in real-world situations.
- The student demonstrates algebraic thinking.
Grade 10
-
Functions and Relationships
- The student demonstrates conceptual understanding of functions, patterns, or sequences including those represented in real-world situations.
- The student demonstrates algebraic thinking.
Functions
-
Interpreting Functions
- Understand the concept of a function and use function notation
- Interpret functions that arise in applications in terms of the context
- Analyze functions using different representations
-
Linear, Quadratic, and Exponential Models
- Interpret expressions for functions in terms of the situation they model
Grades 9-12
-
Algebra
- Analyze change in various contexts
- Understand patterns, relations, and functions
AP Calculus
-
Geometry and Measurement
- Competency Goal 2: The learner will use derivatives to solve problems.
-
Numbers and Operations
- Competency Goal 1: The learner will demonstrate an understanding of the behavior of functions.
Algebra I
-
Quadratic and Other Nonlinear Functions
- 9. The student understands that the graphs of quadratic functions are affected by the parameters of the function and can interpret and describe the effects of changes in the parameters of quadratic functions.
- 10. The student understands there is more than one way to solve a quadratic equation and solves them using appropriate methods.
Secondary
-
AP Calculus
- APC.05 The student will investigate derivatives presented in graphic, numerical, and analytic contexts and the relationship between continuity and differentiability. The derivative will be defined as the limit of the difference quotient and interpreted as an instantaneous rate of change.
- APC.06 The student will investigate the derivative at a point on a curve. This will include finding the slope of a curve at a point, including points at which the tangent is vertical and points at which there are no tangents; using local linear approximation to find the slope of a tangent line to a curve at the point; defining instantaneous rate of change as the limit of average rate of change; and, approximating rate of change from graphs and tables of values.
Student Prerequisites
-
Pre-Calculus:
Students must be able to:
- work with limits and infinity
- understand the concept of tangent lines
-
Algebra:
Students must be able to:
- graph equations
- understand and identify common equations such as trigonometric functions, logarithms, and exponential functions
-
Technological:
Students must be able to:
- perform basic mouse manipulations such as point, click, and drag
- use a browser for experimenting with the activities
Teacher Preparation
- Access to a browser
- A copy of the worksheet for each student
Key Terms
continuous graph
In a graph, a continuous line with no breaks in it forms a continuous graph
function
A function f of a variable x is a rule that assigns to each number x in the function's domain a single number f(x). The word "single" in this definition is very important
graph of the function f
The set of all the points on the coordinate plane of the form (x, f(x)) with x in the domain of f
infinity
Greater than any fixed counting number, or extending forever. No matter how large a number one thinks of, infinity is larger than it. Infinity has no limits
logarithm
The exponent of the power to which a base number must be raised to equal a given number. An example: 2 is the logarithm of 100 to the base 10. One can look at this way: 10 * 10 = 100, which is the same as 102, and 2 is the exponent referred to above
slope of a linear function
The slope of the line y = mx + b is the rate at which y is changing per unit of change in x. The units of measurement of the slope are units of y per unit of x (cf. Linear Functions Discussion).
Lesson Outline
-
Focus and Review
Conduct a review of limits, infinity, and slope to prepare students for the upcoming lesson. Focus on the idea that limits allow you to work with ideas such as
 and sometimes find a meaningful value for them. This will help mentally prepare students to find
the slope of a curve at a single point.
and sometimes find a meaningful value for them. This will help mentally prepare students to find
the slope of a curve at a single point.
Ask the following opening questions:
- What does it mean to say that a line is tangent to a curve?
- Do all lines tangent to a single curve have the same slope?
- How can we find the slope of a line?
-
Objectives
Let the students know what it is they will be doing and learning today. Say something like this:
- Today, class, we are going to learn how to find the slope of lines that are tangent to curves. We are going to be working with computers, but please do not turn on your computers just yet. I want to show you something first.
-
Teacher Input
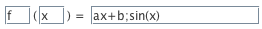
To graphically demonstrate the concept of the "slope" of a curve, open Multi-Function Data Flyer on a projector and show students the following equation:
The graph should look something like this:
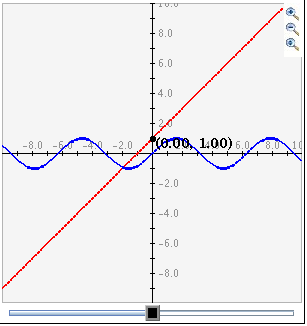
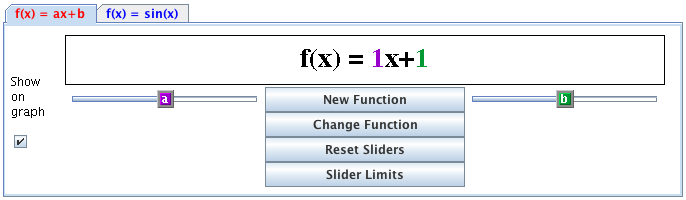
Demonstrate the use of the sliders to change the equation of the straight line.
Ask the following questions:
- Is the straight line currently tangent to the graph of sin(x)?
- What could we do to the graph to make the line tangent to sin(x)? Should we change the slope, the y-intercept, or some combination of the two?
- y = 1x + 0
- y = 0x + 1
- y = 0x - 1
Click the zoom button, then click and drag to zoom in on a small area of the graph. Continue to do so until the visible part of the graph of sin(x) looks like a straight line. Ask the following questions:
- Would it be relatively easy to find the slope of the tangent line to the curve?
- How close is the tangent line to the actual curve graph of sin(x)?
- If the slope of the tangent line to sin(x) at 0 is 1, what is the slope of the curve itself? How do you know?
-
Guided Practice
Introduce Derivate as an applet that can automatically find the slope of any function, even a curved function. Graph the function y=sin(x).
- Demonstrate how to move the sliders to change the location of the tangent line.
- Show how the derivative changes as the slope of the line changes.
- Demonstrate how to change the window and step size as necessary to make functions easier to see.
Discuss the relationship between the slope of the tangent line and the curve itself. Ask the following questions:
- When the function is increasing, is the derivative positive or negative?
- When the function is decreasing, is the derivative positive or negative?
- What happens to the derivative when the function is at a peak or a valley?
-
Independent Practice
Have students work in groups of 2-4 to complete the worksheet. As they do so, ask them to think about the relationship between the derivative of a function and the function itself.
-
Closure
Bring the class back together and discuss what has been learned about derivatives, tangents, and slope. Ask the following questions:
-
How does the derivative of a function relate to the function at a particular point?
- Do you think that all functions have a derivative at all points?
- What if you had a function like y = x^1/3? What happens to the derivative of this function at zero?
- What does this tell you about when it is possible to take the derivative of a function?
-
When you plotted the derivative of
 on the worksheet, did the points form a graph? What graph did they form?
-
Given that, what would you say the general derivative of
is?
- Do you think other functions could also have derivatives that are themselves functions?
-
How does the derivative of a function relate to the function at a particular point?
Alternate Outline
The activities in this lesson can be rearranged in the following ways:
- If only one computer is available, work on the worksheet as a class and have students plot points from the overhead on their own paper. Then, discuss what graph is formed by those points.