What is Function Revolution?
This activity allows the user to create three-dimensional solids by rotating the graphs of functions around either a horizontal or vertical axis. The applet then calculates the volume and surface area of the solid that has been created. This allows the user to practice integration, which is used in the formula for calculating volume and surface area of rotated solids.
In the applet, the user can decide whether to rotate the solid around a vertical or horizontal line. If rotating around a horizontal line, the equations must be functions of x (i.e. f(x)=x+3). If rotating around a vertical line, the equations must be functions of y (i.e. f(y)=y-2). This is necessary when integrating.
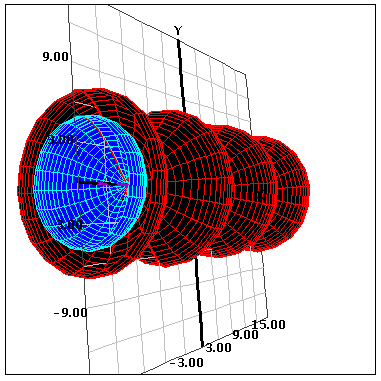
When revolving around an axis, there are two situations that can occur. When only one function is rotated around an axis, it creates a solid. Below is an example of one function rotated around an axis to create a solid.
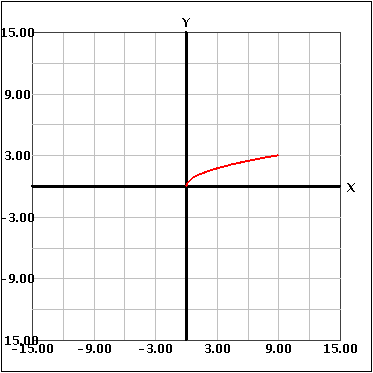
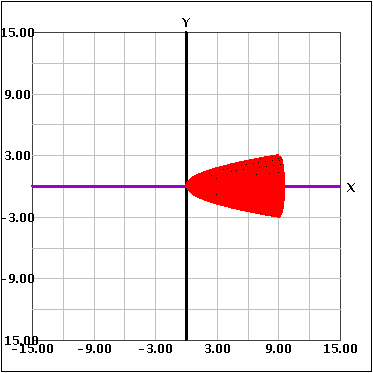
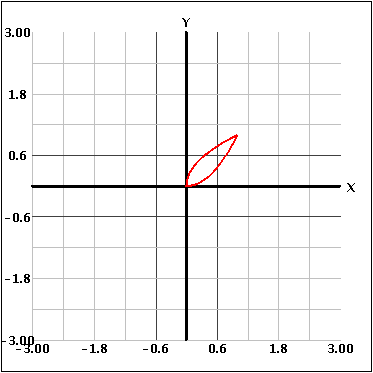
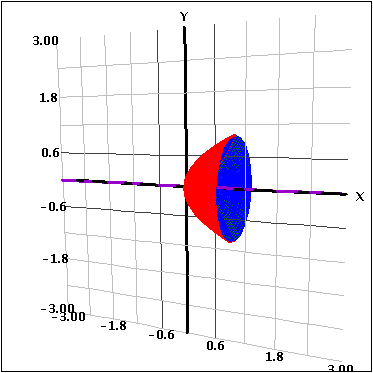
The other situation is when you rotate two functions around an axis. This creates a "hollowed out" figure because you rotate the area in between the curves around the axis. This is shown below.
The activity also allows the user to restrict the bounds of the functions. This allows the user to consider one section of the functions in between intersections. Then, to calculate the entire volume, the user can combine the different sections.
How Do I Use This Activity?
This activity allows the user to find the volume and surface area of various functions as they are rotated around axes. This applet can be used to practice finding integrals and using the disk and washer methods of estimation.
Controls and Output
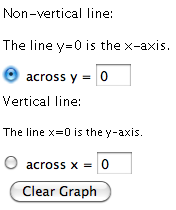
To graph and revolve one or two functions, first choose whether you will be revolving them
around a vertical or non-vertical line. You may specify the axis of rotation by inputting a
number in the boxes labeled "across y = " or "across x = ".
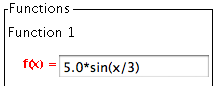
- Then, enter the function(s) into the boxes labeled "Function 1" and "Function 2".
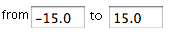
- To change the x-values over which the function is evaluated, change the values in the "from" and "to" boxes.
- When you are finished, press the "Set Functions" button to graph the function(s).

Now you can revolve the function(s) around an axis.
-
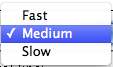
To change the speed of revolution, click on the drop-down menu to choose from Fast,
Medium, and Slow.
-
Finally, click "Revolve" to rotate the function(s) around the chosen axis.

- Once the functions are revolved, you can click and drag anywhere on the graph to rotate the graph and see the functions in 3 dimensions. You can also click "Reset View" to return to the default view orientation.

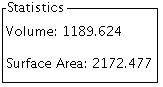
- Once the functions are revolved, the Volume and Surface Area thereof will be displayed in the "Statistics" box.
Once functions are revolved, you can change their color and whether they are solid or wireframe.
-
To switch between solid and wireframe functions, click on the "Solid" or "Wireframe" radio
buttons at the top of the applet.
- The wireframe mode displays the functions as outlines that can be seen through.
- The solid mode fills in these outlines with another color, rendering the functions more like objects so that one cannot see through them.

- To change the color of functions, use the dropdown menus on the right.
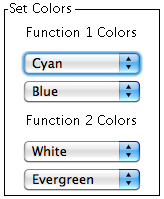
- Note that you can only set one color per function in wireframe mode, but you can set both a "wire" color and a "fill" color in solid mode.
To change the dimensions of the displayed graph, click on "Set Window". Graphed functions whose values go beyond 3 times the dimension of the displayed graph (the "Window") are not shown beyond that point. Making the window larger can allow you to see the entirety of the graphed function. For instance, the function x^2 will have the value of 225 at x=15, but a chart that only extends (with grid lines) up to 15 will not graph the function beyond the value of 45; setting the graph's ymax value to 80 will remedy this.

- A popup box will appear to allow you to set the dimensions of the x- and y-axes.
If, at any point, you wish to get rid of the currently-graphed function(s), simply click on "Clear Graph".
Description
This applet is an expanded version of 3D Transmographer. This 3-dimensional model allows users to explore functions and their revolution around an axis. Once one or two functions have been rotated around an axis, the applet calculates the surface area and volume for the resulting solid. By clicking and dragging on the graph, users can change the vantage point from which they view the graph in order to better understand the functions, the revolution, and the resulting solid.
Place in Mathematics Curriculum
This activity can be used to:
- Explore volumes and surface areas of unique solids
- Introduce how to find volume and surface area using integration
- Practice solving integrals for volume and surface area
- Visualize the rotation of a function or pair of functions
Standards Addressed
Grades 8-12
-
Calculus
- 16.0 Students use definite integrals in problems involving area, velocity, acceleration, volume of a solid, area of a surface of revolution, length of a curve, and work.
- 17.0 Students compute, by hand, the integrals of a wide variety of functions by using techniques of integration, such as substitution, integration by parts, and trigonometric substitution. They can also combine these techniques when appropriate.
Geometry
-
Geometric Measurement and Dimension
- Explain volume formulas and use them to solve problems
AP Calculus
-
Data Analysis and Probability
- Competency Goal 3: The learner will use integrals to solve problems.
Secondary
-
AP Calculus
- APC.15 The student will use integration techniques and appropriate integrals to model physical, biological, and economic situations. The emphasis will be on using the integral of a rate of change to give accumulated change or on using the method of setting up an approximating Riemann sum and representing its limit as a definite integral. Specific applications will include the area of a region; the volume of a solid with known cross-section; the average value of a function; and, the distance traveled by a particle along a line. * * AP Calculus BC will include finding the area of a region (including a region bounded by polar curves) and finding the length of a curve (including a curve given in parametric form).
Be Prepared to
- Explain how integration relates to volume and surface area of rotated solids
- Describe the disk and washer method of calculating volume
- Describe the shell method of calculating surface area
- Explain how dy and dx factor into the calculation of surface area and volume