What is Linear Inequalities?
What is an inequality?
This activity allows the user to graph linear inequalities in 2 variables. Users can input inequalities in algebraic form and graph them on a coordinate plane. The user can graph up to four inequalities as well as many ordered pairs. This activity is an extension of the Graphit applet.
Being able to graph inequalities is important in higher mathematics such as calculus and in areas that use mathematics such as physics.
In this activity, users will input values to create linear inequalities to be graphed. Rather then a straight line appearing as with linear functions, however, the inequality functions will have an area shaded above or below either a dotted or solid line (depending on the chosen inequality). This happens because the x and y values are not fixed (unless the = sign is chosen) and therefore there are many different values that they could exist for the function.
Let's take a look at one example of an inequality: 2X + 2Y LESS THAN 8
When this inequality is graphed, a dotted diagonal line crosses the points (0, 4) and (4, 0) with the area to the left of the line entirely shaded. This occurs because all of the shaded area represents possible values for the function. Let's see how this is done and choose a value for X.
If X = 0 then what are the possible values of Y?
2(0) + 2(Y) LESS THAN 8 0 + 2(Y) LESS THAN 8
Y LESS THAN 4
Therefore, when X=0, all values for Y below 4 could exist and therefore all values below are shaded. There is a dotted line because Y cannot equal 4. While this only shows what Y can be if X is 0, you can also experiment with different values of X (or Y) to find other possible values.
How Do I Use This Activity?
This activity allows the user to plot ordered pairs and algebraic relations on the same coordinate plane.
Controls and Output
-
The area at the top of the screen is where the plot is displayed.
- The Relation and Data areas are for entering inequalities and ordered pairs, respectively. When entering an inequality first enter a value in the box before x and a value in the box before y. Next, select the inequality sign (less than, less than or equal to, equal to, greater than or equal to, or greater than). Lastly, enter a value in the last box. All values must be written as whole numbers or decimal values (not fractions). Once all of the boxes have values in them and the sign has been chosen, select the "Plot/Update" button and the data will appear on the graph. For information about entering data points, see Simple Plot.
-
Once you have created an inequality relation, you can choose several ways to view the relation. By selecting the button "standard form" you will see the inequality written as you typed it in. For example: 2x + 3y LESS THAN 5. By selecting the button "solve for x" you will see the inequality written such that the inequality is solved in terms of x. For example, x LESS THAN -3/2y + 5/2. By selecting the button "solve for y" you will see the inequality written such that the inequality is solved in terms of y. For example, y LESS THAN -2/3x + 5/3.

-
By selecting "Clear Relations" you can erase all values in the relations section, while keeping the data sets.

-
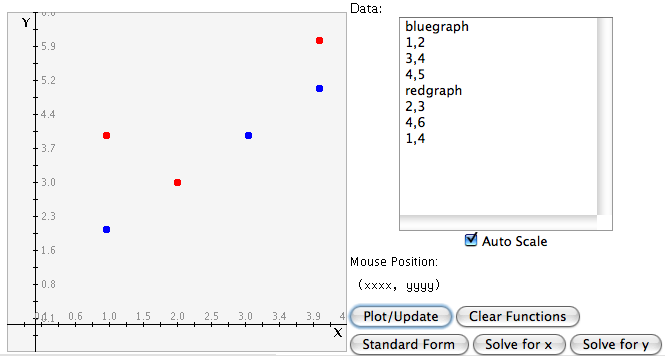
You can plot a total of four relations and infinitely many data sets at once. Separate data sets by typing newgraph or by writing each data set on a line by itself in the Data window. If you want to specify your own colors for the graphs you can replace newgraph with the following keywords: bluegraph, redgraph, greengraph, darkbluegraph, graygraph, magentagraph, purplegraph, crimsongraph and then all of the values following that keyword will turn the corresponding color.
-
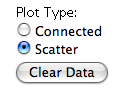
You can choose from two plot types. "Connected" draws a line from one point to the next (before the line is drawn the points are sorted by their x coordinates.) "Scatter Plot" just draws the points as dots on the graph. These options do not affect the way relations are graphed. By selecting "Clear Data" you can erase all data sets, while keeping values in the functions section.
-
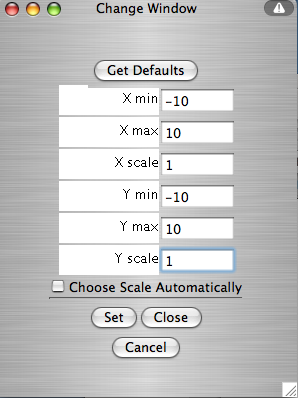
The Set Window button brings up a separate window where you can determine how the coordinate plane will appear on your screen. X min and X max are the minimum and maximum x-values displayed on the graph. Similarly for Y min and Y max. X scale is the distance between vertical gridlines. Y scale is the distance between horizontal gridlines. If the Choose Scale Automatically box is checked, the applet will choose appropriate values for you to display all your data. If you uncheck that box, you override the auto scale values with your own. Any changes you make to the window parameters will take effect once you select the Set button.
-
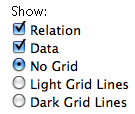
You can choose what you see on the graph. You can select to show all relations, all data, and/or the grid lines by checking the appropriate box or radio button in the Show section.
-
The applet also can tell you the location of any click. Just click the mouse anywhere on the graph that you want to know the coordinates of and the coordinates will appear under the words Mouse Position:

Description
This activity allows the user to plot ordered pairs and linear inequality relations on the same coordinate plane. This activity would work well in groups of two to four for about forty-five minutes if you use the exploration questions and twenty minutes otherwise.
Place in Mathematics Curriculum
This activity can be used to:
- illustrate inequalities on the Cartesian coordinate system
- practice students' pattern recognition skills
- practice students' graph reading skills
- illustrate the relationship between graphical and algebraic representations of functions
Standards Addressed
Grade 6
-
Functions and Relationships
- The student demonstrates algebraic thinking.
Grade 7
-
Functions and Relationships
- The student demonstrates algebraic thinking.
Grade 8
-
Functions and Relationships
- The student demonstrates algebraic thinking.
Grade 9
-
Functions and Relationships
- The student demonstrates conceptual understanding of functions, patterns, or sequences including those represented in real-world situations.
- The student demonstrates algebraic thinking.
Grade 10
-
Functions and Relationships
- The student demonstrates conceptual understanding of functions, patterns, or sequences including those represented in real-world situations.
- The student demonstrates algebraic thinking.
Grade 7
-
Algebra and Functions
- 1.0 Students express quantitative relationships by using algebraic terminology, expressions, equations, inequalities, and graphs
- 3.0 Students graph and interpret linear and some nonlinear functions
- 4.0 Students solve simple linear equations and inequalities over the rational numbers
Eighth Grade
-
Expressions and Equations
- Understand the connections between proportional relationships, lines, and linear equations.
- Analyze and solve linear equations and pairs of simultaneous linear equations.
-
Functions
- Define, evaluate, and compare functions.
- Use functions to model relationships between quantities.
Algebra
-
Reasoning with Equations and Inequalities
- Represent and solve equations and inequalities graphically
Functions
-
Building Functions
- Build a function that models a relationship between two quantities
- Build new functions from existing functions
-
Linear, Quadratic, and Exponential Models
- Construct and compare linear, quadratic, and exponential models and solve problems
Grades 9-12
-
Algebra
- Represent and analyze mathematical situations and structures using algebraic symbols
- Understand patterns, relations, and functions
Algebra I
-
Algebra
- Competency Goal 4: The learner will use relations and functions to solve problems.
Algebra II
-
Algebra
- Competency Goal 2: The learner will use relations and functions to solve problems.
Technical Mathematics II
-
Data Analysis and Probability
- Competency Goal 2: The learner will use relations and functions to solve problems.
Integrated Mathematics
-
Algebra
- Competency Goal 4: The learner will use relations and functions to solve problems.
Integrated Mathematics III
-
Algebra
- Competency Goal 3: The learner will use relations and functions to solve problems.
Integrated Mathematics IV
-
Algebra
- Competency Goal 4: The learner will use relations and functions to solve problems.
Algebra I
-
Foundation for Functions
- 1. The student understands that a function represents a dependence of one quantity on another and can be described in a variety of ways.
-
Linear Functions
- 5. The student understands that linear functions can be represented in different ways and translates among their various representations.
- 6. The student understands the meaning of the slope and intercepts of the graphs of linear functions and zeros of linear functions and interprets and describes the effects of changes in parameters of linear functions in real-world and mathematical situations.
-
Quadratic and Other Nonlinear Functions
- 9. The student understands that the graphs of quadratic functions are affected by the parameters of the function and can interpret and describe the effects of changes in the parameters of quadratic functions.
- 11. The student understands there are situations modeled by functions that are neither linear nor quadratic and models the situations.
Be Prepared to
- answer the question "Why are the areas shaded below/above the line?"
- answer the question "Why are some of my lines solid and others dashed?"
- discuss the concepts of multiple outputs for a single function
- discuss a solution set for multiple inequalities