What is Fraction Pointer?
This activity allows the user to visually experiment with the relationship between the value of fractions and areas within a square or a circle. The user is asked to create given fractions and construct original fractions.
The activity provides the user with two fractions, a pair of shapes, and a number line. Each shape is connected to a point on the number line corresponding to the fraction of the shape colored in. The user begins with empty shapes, which he/she can divide into sections and color the desired portion.
When both shapes are correctly divided and colored, a third box appears. The user is asked to divide and color the new shape to create a new fraction that lies between the values of the original two. As the student colors in the third box, a marker moves to the corresponding value on the number line.
After all three boxes are correctly colored, the student must enter the value of the third fraction created. Giving the exact value of the fraction serves to reinforce the relationship between the area colored and the value of the fraction on the number line.
How Do I Use This Activity?
This activity allows the user to practice fraction, decimal, and percentage skills. The user has to illustrate two fractions, decimals, or percentages, find and illustrate a third fraction, decimal, or percentage between those two, and then name the third fraction, decimal or percentage.
Controls and Output
This activity requires you to perform three steps. First, you have to create diagrams of two given endpoint fractions, decimals, or percentages by dividing a square or circle into equal parts and coloring in the appropriate areas. Then, you have to create a diagram of a third fraction, decimal, or percentage that is between the two endpoints; the third pointer will help you find it. Finally, you have to give the name, in lowest terms, of your middle fraction, decimal, or percentage.
- You can choose the game type by clicking one of the radio buttons next to Fraction, Decimal, or Percentage.
-
You can choose from two different types of diagrams in the
Choose Shape pull-down menu: square or circle. If you change shapes in the middle of a problem, all your
work to that point will be lost.

-
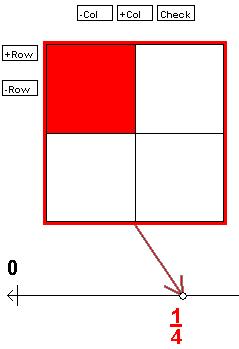
Below is an example of the square fraction diagram. You can change the number of columns by
using the
-Col button to remove columns and the
+Col button to add columns. You can change the number of rows by using the
+Row and
-Row buttons. To color a section in the diagram, click the section. You can un-color a section
by clicking it again.

-
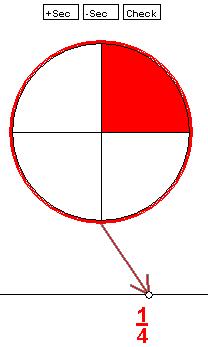
Below is an example of the circular fraction diagram. You can change the number of sections
by using the
+Sec button to add sections and the
-Sec button to remove sections. To color a section in the diagram, click the section. You can
un-color a section by clicking it again.

- For each of the two endpoint fractions, decimals, or percentages you should make the colored part of the diagram equal to the corresponding fraction, decimal, or percentage. Then click the Check button for each diagram to check your answer. If the diagram is correct, the word "Correct" will be printed on top of the diagram; if it isn't correct, the word "Incorrect" will be printed instead. If your answer is incorrect, you can try again.
- After you correctly diagram the two endpoints, you will be asked to diagram a new fraction, decimal, or percentage between the endpoints. You can use any answer you want as long as it is between the two endpoints. As you create the new diagram, the arrow at the bottom of your diagram will move so you can tell when you are between the two endpoints. When you think your middle answer is correctly colored and between the two endpoints, click the Check button to see if you are correct.
-
After you correctly create the middle diagram, you will be asked to name the middle
fraction, decimal, or percentage. In the indicated box, type the middle fraction in lowest
terms, the middle decimal with two digits of precision, or the middle percentage. If you
wish to indicate a repeating decimal, use three digits of precision instead of two. Then
click the
Check button.

-
At any time during the activity, you can click the
Start Over button or the
Next Question button. The
Start Over button will restart the current question from the very beginning. The
Next Question button will get a new question.

- This activity will automatically record how successful you are at answering the questions. To view the score, press the Show Score button at the bottom of the activity and a pop-up window will appear with the scoreboard. The information in this window is divided into two sections. The statistics for the current question are given in the top half of the window, and the statistics for all questions together are given in the bottom half. To close this pop-up window press the Close button or click back on the main window.
- To pause the scoring, press the Active button at the bottom of the screen and it will change to a Paused button. To resume scoring, press the Paused button.
- To reset the scoreboard, open the scoreboard using the Show Score button and then press the Reset button.
Description
This activity allows the user to visually experiment with the relationship between the value of fractions and areas within a square or a circle. This activity would work well in groups of two to four for about 30 minutes if you use the exploration questions.
Place in Mathematics Curriculum
This activity can be used to:
- Practice simplifying fractions
- Compare fractions and order them on a number line
- Develop methods to estimate the values of fractions
Standards Addressed
Grade 3
-
Numeration
- The student demonstrates conceptual understanding of simple fractions with denominators 2, 3, 4, or 10.
Grade 4
-
Numeration
- The student demonstrates conceptual understanding of fractions with denominators 2 through 12.
Grade 5
-
Numeration
- The student demonstrates conceptual understanding of positive fractions with denominators 1 through 12 and 100 with proper and mixed numbers and benchmark percents (10%, 25%, 50%, 75%, 100%).
Grade 6
-
Numeration
- The student demonstrates conceptual understanding of fractions (proper or mixed numbers), decimals, percents (whole number), or integers.
- The student demonstrates conceptual understanding of fractions, mixed numbers, or percents.
Grade 7
-
Numeration
- The student demonstrates conceptual understanding of rational numbers (fractions, decimals, percents, or integers).
- The student demonstrates conceptual understanding of positive fractions, decimals, or percents.
Grade 8
-
Numeration
- The student demonstrates conceptual understanding of real numbers.
- The student demonstrates conceptual understanding of rational numbers (fractions, decimals, or percents including integers).
Grade 9
-
Numeration
- The student demonstrates conceptual understanding of real numbers.
Grade 10
-
Numeration
- The student demonstrates conceptual understanding of real numbers.
Third Grade
-
Number and Operations-Fractions
- Develop understanding of fractions as numbers.
Fourth Grade
-
Number and Operations-Fractions
- Extend understanding of fraction equivalence and ordering.
- Build fractions from unit fractions by applying and extending previous understandings of operations on whole numbers.
Fifth Grade
-
Number and Operations-Fractions
- Use equivalent fractions as a strategy to add and subtract fractions.
- Apply and extend previous understandings of multiplication and division to multiply and divide fractions.
Grades 6-8
-
Numbers and Operations
- Understand meanings of operations and how they relate to one another
Grade 4
-
Number and Operations, Measurement, Geometry, Data Analysis and Probability, Algebra
- COMPETENCY GOAL 1: The learner will read, write, model, and compute with non-negative rational numbers.
Grade 5
-
Number and Operations, Measurement, Geometry, Data Analysis and Probability, Algebra
- COMPETENCY GOAL 1: The learner will understand and compute with non-negative rational numbers.
Grade 6
-
Number and Operations, Measurement, Geometry, Data Analysis and Probability, Algebra
- COMPETENCY GOAL 1: The learner will understand and compute with rational numbers.
Grade 7
-
Number and Operations, Measurement, Geometry, Data Analysis and Probability, Algebra
- COMPETENCY GOAL 1: The learner will understand and compute with rational numbers.
Grade 3
-
Geometry and Spatial Reasoning
- 10. The student recognizes that a line can be used to represent numbers and fractions and their properties and relationships. The student is expected to locate and name points on a number line using whole numbers and fractions, including halves and fourths.
-
Number, Operation, and Quantitative Reasoning
- 2. The student uses fraction names and symbols (with denominators of 12 or less) to describe fractional parts of whole objects or sets of objects.
Grade 4
-
Geometry and Spatial Reasoning
- 10. The student recognizes the connection between numbers and their properties and points on a line. The student is expected to locate and name points on a number line using whole numbers, fractions such as halves and fourths, and decimals such as tenths.
-
Number, Operation, and Quantitative Reasoning
- 2. The student describes and compares fractional parts of whole objects or sets of objects.
3rd Grade
-
Number and Number Sense
- 3.05a The student will divide regions and sets to represent a fraction;
- 3.05b The student will name and write the fractions represented by a given model (area/region, length/measurement, and set). Fractions (including mixed numbers) will include halves, thirds, fourths, eighths, and tenths.
- 3.06 The student will compare the numerical value of two fractions having like and unlike denominators, using concrete or pictorial models involving areas/regions, lengths/measurements, and sets.
4th Grade
-
Number and Number Sense
- 4.3 The student will compare the numerical value of fractions (with like and unlike denominators) having denominators of 12 or less, using concrete materials.
Textbooks Aligned
Grade Six
-
Bits and Pieces I
- Investigation One: Fund-Raising Fractions
- Investigation Two: Comparing Fractions
-
Bits and Pieces II
- Investigation Three: Estimating with Fractions and Decimals
Book 1
-
Module 2 - Patterns and Designs
- Section 3: Equivalent Fractions
-
Module 5 - Creating Things
- Section 1: Fraction Number Sense
Book 2
-
Module 3 - A Universal Language
- Section 2: Comparing Fractions, Adding and Subtracting Fractions
7th
-
Module 3 - Codes
- Section 3: Fractions
Book 1
-
From Zero to One and Beyond
- Lesson 2: Fraction Circles
Book 2
-
Buyer Beware
- Lesson 5: Dancing Ratios
- Lesson 6: Which Brand Has the Most Chocolate?
Grade 5
-
Some of the Parts
- Fractions
- Relationships between Fractions
- Operations with Fractions
Grade 6
-
Fraction Times
- Operations with Fractions
- Fraction/Percent/Decimal/Ration Relationships
Grade 7
-
Cereal Numbers
- Fractions
- Multiplying and Dividing Fractions
Be Prepared to
- give implicit directions on what they are to do. For example "Today we are going to compare fractions and use the number line."
- discuss different methods to mentally approximate fractions.