What is Marbles?
This activity allows the user to pull marbles from a 'bag' in a variety of ways in order to explore several different concepts involving randomness and probability. The user controls the number and color of marbles located in the "bag". The user can also change whether the marbles are replaced after each draw and if the order in which the marbles are drawn matters. A table presents the user with a summary of the trials, and allows them to explore the difference between experimental and theoretical results.
Probability began in the middle of the seventeenth century by a man named Pascal. One day a man proposed a question about gambling. His question was "If I play a game that I have eight rolls to roll a six and I fail the first three times, how much of my bet should I get back?" The game involved chance just as most of games do now, such as Monopoly and card games. Las Vegas is a city that is dominated by people that have invested in this field of mathematics. Today, probability has found its way into the fields of science, medicine, and statistics.
How Do I Use This Activity?
This activity allows the user to investigate probability and randomness by simulating marbles being drawn out of a bag. By adjusting various settings, the student can learn about conditional probability and statistics.
Controls and Output
-
At the top left of the screen, there is a place where the user can specify how many
marbles of each kind they wish to use. The number of marbles for each of the four colors
must of course be an integer and less than 1000. If you put a zero as an entry, that is as
if you are not putting any marbles of that color in the bag.

-
Below, you can specify how many marbles you wish to draw at one time (1,2, or 3 marbles).
The number of marbles you draw must be less than or equal to the total number of marbles
in your 'bag'.

-
The user is able to decide whether order matters, in other words, would a pick of
red-blue-red be the same as red-red-blue? By selecting Order Does Not Matter, the table
becomes shorter because like combinations are removed.

-
The user can decide whether the marbles are replaced back in the bag after they are drawn
or whether they are simply left out.

-
The user can determine how many individual trials they want to calculate with each run.
The number of trials must not be greater than 10000. By clicking
Run Trials the trials are calculated.

-
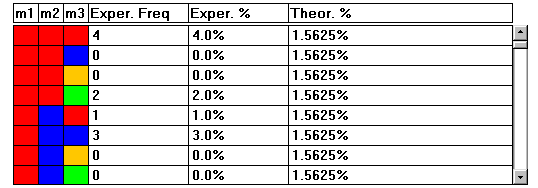
After running the trials, the data table should now include the experimental results. The
first three columns indicate the order and color of the possible draw. The fourth column
tells you the frequency in which that combination came up in your trials. The fifth column
tells you the experimental percentage of the trials that came up with that combination and
the last column tells you the theoretical percentage. You can use the scrollbar on the
right to look through the trial data.

-
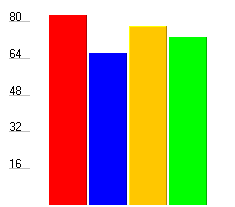
After running a trial, the previously blank spot at the bottom left should now be ocupied
by a bar chart. The bar chart indicates how many marbles of each individual color are
drawn in total.

-
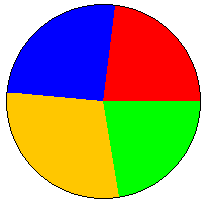
By clicking on the barchart, the user can change it to a piechart which displays the same
data. By clicking on the graph repeatedly, one can toggle between both types of graphs.

-
At the bottom of the Marble Info box, the total number of accumlated trials is displayed
along with the
Clear Stats button which allows the user to clear the data and start fresh.

Description
This activity allows the user to emulate pulling marbles out of a bag under various conditions. This activity would work well in groups of two or three for about twenty-five to thirty minutes if you use the exploration questions and ten to fifteen minutes otherwise.
Place in Mathematics Curriculum
This activity can be used to:
- introduce the notions of chance and probability
- motivate the notion of conditional probability
- motivate the notion of sampling with and without replacement
- motivate the notion of random numbers
Standards Addressed
Grade 6
-
Statistics and Probability
- The student demonstrates a conceptual understanding of probability and counting techniques.
Grade 7
-
Statistics and Probability
- The student demonstrates a conceptual understanding of probability and counting techniques.
Grade 8
-
Statistics and Probability
- The student demonstrates a conceptual understanding of probability and counting techniques.
Grade 9
-
Statistics and Probability
- The student demonstrates a conceptual understanding of probability and counting techniques.
Grade 10
-
Statistics and Probability
- The student demonstrates a conceptual understanding of probability and counting techniques.
Seventh Grade
-
Statistics and Probability
- Use random sampling to draw inferences about a population.
- Investigate chance processes and develop, use, and evaluate probability models.
Statistics and Probability
-
Conditional Probability and the Rules of Probability
- Understand independence and conditional probability and use them to interpret data
- Use the rules of probability to compute probabilities of compound events in a uniform probability model
-
Making Inferences and Justifying Conclusions
- Understand and evaluate random processes underlying statistical experiments
- Make inferences and justify conclusions from sample surveys, experiments, and observational studies
-
Using Probability to Make Decisions
- Calculate expected values and use them to solve problems
- Use probability to evaluate outcomes of decisions
Grades 3-5
-
Data Analysis and Probability
- Understand and apply basic concepts of probability
Grades 6-8
-
Data Analysis and Probability
- Understand and apply basic concepts of probability
Grades 9-12
-
Data Analysis and Probability
- Develop and evaluate inferences and predictions that are based on data
- Formulate questions that can be addressed with data and collect, organize, and display relevant data to answer them
- Understand and apply basic concepts of probability
Grade 4
-
Number and Operations, Measurement, Geometry, Data Analysis and Probability, Algebra
- COMPETENCY GOAL 4: The learner will understand and use graphs, probability, and data analysis.
Grade 6
-
Number and Operations, Measurement, Geometry, Data Analysis and Probability, Algebra
- COMPETENCY GOAL 4: The learner will understand and determine probabilities.
Integrated Mathematics
-
Data Analysis and Probability
- Competency Goal 3: The learner will analyze data and apply probability concepts to solve problems.
AP Statistics
-
Data Analysis and Probability
- Competency Goal 3: The learner will collect and analyze data to solve problems.
-
Number and Operations
- Competency Goal 1: The learner will analyze univariate data to solve problems.
6th Grade
-
Data Analysis and Probability
- The student will demonstrate through the mathematical processes an understanding of the relationships within one population or sample.
7th Grade
-
Data Analysis and Probability
- The student will demonstrate through the mathematical processes an understanding of the relationships between two populations or samples.
8th Grade
-
Data Analysis and Probability
- The student will demonstrate through the mathematical processes an understanding of the relationships between two variables within one population or sample.
Textbooks Aligned
8th
-
Module 2 - At the Mall
- Section 3: Exploring Probability
Be Prepared to
- give implicit directions on what they are to do. For example, "Today we are going to experiment with conditional probability, theoretical probability, experimental probability,... after we have played with the applet we will try to answer the exploration questions..."
- answer the question "What is conditional probability?"
- discuss graphical representations of data