What is Pie Chart?
This applet allows the user to make pie charts.
A pie chart is a graphical way to organize data. All pie charts compare parts of a whole. For example, a pie chart for the time you spend at school could compare the amount of time you spend in each class and at lunch.
A pie chart uses percentages or fractions to compare the data. The whole is equal to 100%, which is the same as 1. So if you spend 7 hours at school and 55 minutes of that time is spent eating lunch then 13% of your school day is spent eating lunch. This can be figured by converting 7 hours to 420 minutes (you always must compare using the same unit of measure or your numbers are meaningless). Then solve the proportion 55 minutes / 420 minutes = ? % / 100% which works out to be about 13%.
The next step in creating the pie chart is determining what the angle measure should be to represent 13%. Since there are 360 degrees in a circle, multiply 13%(0.13) by 360 to get 46.8 degrees. See if you can make a pie chart that represents what you do in a day.
How Do I Use This Activity?
This applet allows the user to make pie charts.
Controls and Output
-
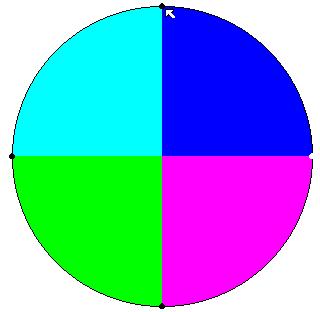
On lines where two colors meet is a small black dot on the edge of the circle. If you
click on the black dot and drag you will change the size of the two sections that meet on
that line.
-
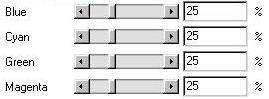
The size of the sections can also be changed by using the scroll bars or the text boxes
beside each color. Remember that the text boxes have to add up to 100%.
-
To view your changes click on the "update chart" button.

-
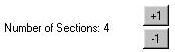
To change the number of section in the circle click on the "+1" or "-1" button.
Description
This activity allows the user to view and make their own pie charts. A pie chart is an excellent way to show how the relative sizes of the parts of a whole. This activity would work well in same ability groups of two to four for about thirty to forty minutes if you use the exploration questions and five to ten minutes otherwise.
Place in Mathematics Curriculum
This activity can be used to:
- illustrate the percentages and how they should add to 100%
- develop estimating skills
- introduce the idea of a pie chart
- practice students skills at reading pie charts
- give students insight into drawing pie charts
- develop recognition and understanding of data representations
Standards Addressed
Grade 3
-
Statistics and Probability
- The student demonstrates an ability to classify and organize data.
- The student demonstrates an ability to analyze data (comparing, explaining, interpreting, or justifying conclusions).
Grade 4
-
Statistics and Probability
- The student demonstrates an ability to classify and organize data.
- The student demonstrates an ability to analyze data (comparing, explaining, interpreting, evaluating; drawing or justifying conclusions).
Grade 5
-
Statistics and Probability
- The student demonstrates an ability to classify and organize data.
- The student demonstrates an ability to analyze data (comparing, explaining, interpreting, evaluating; drawing or justifying conclusions).
Grade 6
-
Statistics and Probability
- The student demonstrates an ability to classify and organize data.
- The student demonstrates an ability to analyze data (comparing, explaining, interpreting, evaluating; drawing or justifying conclusions).
Grade 7
-
Statistics and Probability
- The student demonstrates an ability to classify and organize data.
- The student demonstrates an ability to analyze data (comparing, explaining, interpreting, evaluating, making predictions; drawing or justifying conclusions).
Grade 8
-
Statistics and Probability
- The student demonstrates an ability to classify and organize data.
- The student demonstrates an ability to analyze data (comparing, explaining, interpreting, evaluating, making predictions, describing trends; drawing, formulating, or justifying conclusions).
Grade 9
-
Statistics and Probability
- The student demonstrates an ability to classify and organize data.
- The student demonstrates an ability to analyze data (comparing, explaining, interpreting, evaluating, making predictions, describing trends; drawing, formulating, or justifying conclusions).
Grade 10
-
Statistics and Probability
- The student demonstrates an ability to classify and organize data.
- The student demonstrates an ability to analyze data (comparing, explaining, interpreting, evaluating, making predictions, describing trends; drawing, formulating, or justifying conclusions).
Grade 4
-
Statistics, Data Analysis, and Probability
- 1.0 Students organize, represent, and interpret numerical and categorical data and clearly communicate their findings
Grade 5
-
Statistics, Data Analysis, and Probability
- 1.0 Students display, analyze, compare, and interpret different data sets, including data sets of different sizes
Third Grade
-
Measurement and Data
- Represent and interpret data.
Fourth Grade
-
Measurement and Data
- Represent and interpret data.
Fifth Grade
-
Measurement and Data
- Represent and interpret data.
Statistics and Probability
-
Interpreting Categorical and Quantitative Data
- Summarize, represent, and interpret data on a single count or measurement variable
Grades 3-5
-
Data Analysis and Probability
- Select and use appropriate statistical methods to analyze data
Grades 6-8
-
Data Analysis and Probability
- Formulate questions that can be addressed with data and collect, organize, and display relevant data to answer them
- Select and use appropriate statistical methods to analyze data
-
Numbers and Operations
- Understand meanings of operations and how they relate to one another
Grades 9-12
-
Data Analysis and Probability
- Formulate questions that can be addressed with data and collect, organize, and display relevant data to answer them
Grade 5
-
Number and Operations, Measurement, Geometry, Data Analysis and Probability, Algebra
- COMPETENCY GOAL 4: The learner will understand and use graphs and data analysis.
Grade 7
-
Number and Operations, Measurement, Geometry, Data Analysis and Probability, Algebra
- COMPETENCY GOAL 4: The learner will understand and use graphs and data analysis.
Grade 8
-
Number and Operations, Measurement, Geometry, Data Analysis and Probability, Algebra
- COMPETENCY GOAL 4: The learner will understand and use graphs and data analysis.
Introductory Mathematics
-
Algebra
- COMPETENCY GOAL 4: The learner will understand and use graphs and data analysis.
-
Data Analysis and Probability
- COMPETENCY GOAL 3: The learner will understand and use graphs and data analysis.
Advanced Functions and Modeling
-
Data Analysis and Probability
- Competency Goal 1: The learner will analyze data and apply probability concepts to solve problems.
Integrated Mathematics
-
Data Analysis and Probability
- Competency Goal 3: The learner will analyze data and apply probability concepts to solve problems.
AP Statistics
-
Data Analysis and Probability
- Competency Goal 3: The learner will collect and analyze data to solve problems.
-
Number and Operations
- Competency Goal 1: The learner will analyze univariate data to solve problems.
5th Grade
-
Data Analysis & Probability
- The student will understand and apply basic statistical and probability concepts in order to organize and analyze data and to make predictions and conjectures.
6th Grade
-
Data Analysis & Probability
- Content Standard 5.0 The student will understand and apply basic statistical and probability concepts in order to organize and analyze data and to make predictions and conjectures.
7th Grade
-
Data Analysis & Probability
- The student will understand and apply basic statistical and probability concepts in order to organize and analyze data and to make predictions and conjectures.
8th Grade
-
Data Analysis & Probability
- The student will understand and apply basic statistical and probability concepts in order to organize and analyze data and to make predictions and conjectures.
4th Grade
-
Data Analysis & Probability
- The student will understand and apply basic statistical and probability concepts in order to organize and analyze data and to make predictions and conjectures.
Grade 4
-
Number, Operation, and Quantitative Reasoning
- 2. The student describes and compares fractional parts of whole objects or sets of objects.
-
Probability and Statistics
- 13. The student solves problems by collecting, organizing, displaying, and interpreting sets of data.
Grade 5
-
Probability and Statistics
- 13. The student solves problems by collecting, organizing, displaying, and interpreting sets of data.
8th Grade
-
Probability and Statistics
- 8.12 The student will make comparisons, predictions, and inferences, using information displayed in frequency distributions; box-and-whisker plots; scattergrams; line, bar, circle, and picture graphs; and histograms.
6th Grade
-
Probability and Statistics
- 6.18a The student, given a problem situation, will collect, analyze, display, and interpret data in a variety of graphical methods, including line, bar, and circle graphs
Textbooks Aligned
Book 2
-
Module 7 - Health and Wellness
- Section 4: Circle Graphs
7th
-
Module 7 - MATH-Thematical Mix
- Section 4: Box-and-Whisker Plots and Circle Graphs
Be Prepared to
- answer the question "Why does the pie chart always sum to one hundred percent?"
- discuss pie charts, the idea of the whole, how to make predictions based on data