What is Bar Graph?
The Bar Graph applets allow the user to graphically display data frequency using a bar graph. This particular applet allows the user to enter his/her own data as well as manipulate the y-axis values. The ability to manipulate the y-axis values allows the creation of potentially misleading graphs.
Bar graphs, similarly to histograms, are graphical data representations based on frequency. Histograms are a type of bar graph. The feature, which distinguishes a histogram from a bar graph, is that each bar on a histogram represents a range of data, where each bar on a bar graph represents a specific category. For example:

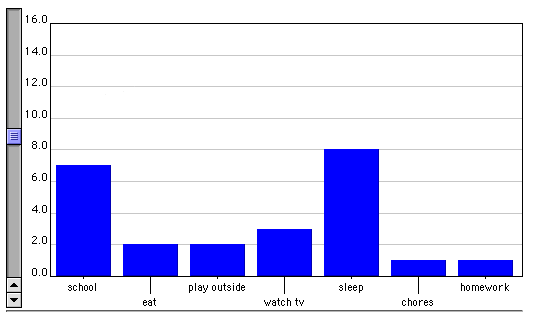
In this bar graph each bar represents a specific part of this student's day, while the y-axis shows the number of hours.

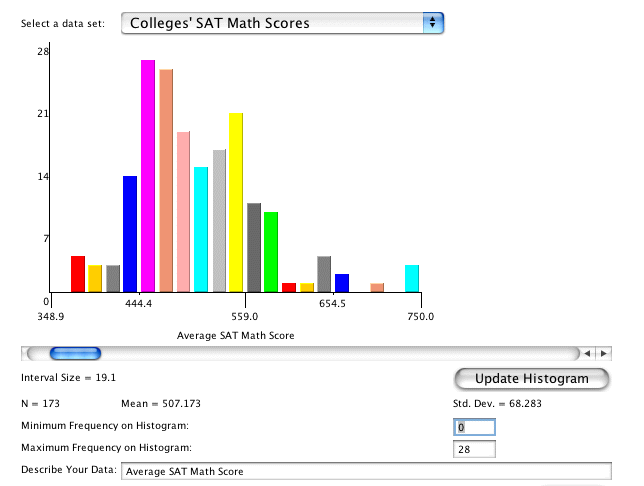
In this histogram each bar represents a 19.1 point range of SAT scores.
How Do I Use This Activity?
This activity allows the user to graph data sets in bar graphs. The color, thickness, and scale of the graph are adjustable. Users may input their own data, use or alter pre-made data sets.
Controls and Output
-
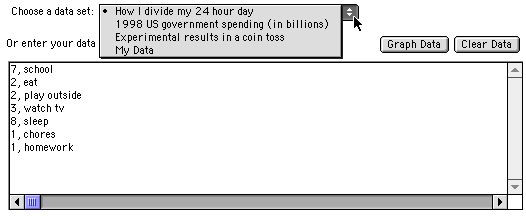
Pre-made data sets may be selected from a choice menu. To alter the data, the user may
change the data displayed in the data box below the choice menu, and hit the "Graph Data"
button. To clear all data, the user may hit the "Clear Data" button. The choice menu, data
box with data, and the two buttons are shown below.

- The user may manually adjust the Y scale of the bar graph by dragging the vertical scrollbar next to the graph. The thickness of the bars may be altered by dragging the scrollbar on the X axis.
-
To change the scale of the graph to a specific value, the user may enter Maximum and
Minimum Y scale values in the Number Inputs, and click the "Set Min and Max" button, all
shown below.

- To change the color of the bars, the user may select from the Bar Color drop down choice menu.
Description
This activity allows the user to graph data on a bar graph . Students can use predefined data sets or enter their own data. Users can also change graph properties such as the scale and the color of the bars. This activity would work well in small groups of 3-4 for about 25-30 minutes if you use the exploration questions and 15-20 minutes otherwise.
Place in Mathematics Curriculum
This activity can be used to:
- Demonstrate the idea of a bar graph
- Create bar graphs
- Give students practice in reading bar graphs
- Display the purpose of visual representations of data
Standards Addressed
Grade 3
-
Statistics and Probability
- The student demonstrates an ability to classify and organize data.
- The student demonstrates an ability to analyze data (comparing, explaining, interpreting, or justifying conclusions).
Grade 4
-
Statistics and Probability
- The student demonstrates an ability to classify and organize data.
- The student demonstrates an ability to analyze data (comparing, explaining, interpreting, evaluating; drawing or justifying conclusions).
Grade 5
-
Statistics and Probability
- The student demonstrates an ability to classify and organize data.
- The student demonstrates an ability to analyze data (comparing, explaining, interpreting, evaluating; drawing or justifying conclusions).
Grade 6
-
Statistics and Probability
- The student demonstrates an ability to classify and organize data.
- The student demonstrates an ability to analyze data (comparing, explaining, interpreting, evaluating; drawing or justifying conclusions).
Grade 7
-
Statistics and Probability
- The student demonstrates an ability to classify and organize data.
- The student demonstrates an ability to analyze data (comparing, explaining, interpreting, evaluating, making predictions; drawing or justifying conclusions).
Grade 8
-
Statistics and Probability
- The student demonstrates an ability to classify and organize data.
- The student demonstrates an ability to analyze data (comparing, explaining, interpreting, evaluating, making predictions, describing trends; drawing, formulating, or justifying conclusions).
Grade 9
-
Statistics and Probability
- The student demonstrates an ability to classify and organize data.
- The student demonstrates an ability to analyze data (comparing, explaining, interpreting, evaluating, making predictions, describing trends; drawing, formulating, or justifying conclusions).
Grade 10
-
Statistics and Probability
- The student demonstrates an ability to classify and organize data.
- The student demonstrates an ability to analyze data (comparing, explaining, interpreting, evaluating, making predictions, describing trends; drawing, formulating, or justifying conclusions).
Grade 4
-
Statistics, Data Analysis, and Probability
- 1.0 Students organize, represent, and interpret numerical and categorical data and clearly communicate their findings
Grade 5
-
Statistics, Data Analysis, and Probability
- 1.0 Students display, analyze, compare, and interpret different data sets, including data sets of different sizes
Third Grade
-
Measurement and Data
- Represent and interpret data.
Fourth Grade
-
Measurement and Data
- Represent and interpret data.
Fifth Grade
-
Measurement and Data
- Represent and interpret data.
Statistics and Probability
-
Interpreting Categorical and Quantitative Data
- Summarize, represent, and interpret data on a single count or measurement variable
Grades 3-5
-
Data Analysis and Probability
- Select and use appropriate statistical methods to analyze data
Grades 6-8
-
Data Analysis and Probability
- Select and use appropriate statistical methods to analyze data
Grade 4
-
Number and Operations, Measurement, Geometry, Data Analysis and Probability, Algebra
- COMPETENCY GOAL 4: The learner will understand and use graphs, probability, and data analysis.
Grade 5
-
Number and Operations, Measurement, Geometry, Data Analysis and Probability, Algebra
- COMPETENCY GOAL 4: The learner will understand and use graphs and data analysis.
Grade 7
-
Number and Operations, Measurement, Geometry, Data Analysis and Probability, Algebra
- COMPETENCY GOAL 4: The learner will understand and use graphs and data analysis.
Grade 8
-
Number and Operations, Measurement, Geometry, Data Analysis and Probability, Algebra
- COMPETENCY GOAL 4: The learner will understand and use graphs and data analysis.
Introductory Mathematics
-
Data Analysis and Probability
- COMPETENCY GOAL 3: The learner will understand and use graphs and data analysis.
Advanced Functions and Modeling
-
Data Analysis and Probability
- Competency Goal 1: The learner will analyze data and apply probability concepts to solve problems.
Integrated Mathematics
-
Data Analysis and Probability
- Competency Goal 3: The learner will analyze data and apply probability concepts to solve problems.
AP Statistics
-
Data Analysis and Probability
- Competency Goal 3: The learner will collect and analyze data to solve problems.
-
Number and Operations
- Competency Goal 1: The learner will analyze univariate data to solve problems.
3rd Grade
-
Data Analysis and Probability
- The student will demonstrate through the mathematical processes an understanding of organizing, interpreting, analyzing and making predictions about data, the benefits of multiple representations of a data set, and the basic concepts of probability.
5th Grade
-
Data Analysis and Probability
- The student will demonstrate through the mathematical processes an understanding of investigation design, the effect of data-collection methods on a data set, the interpretation and application of the measures of central tendency, and the application of basic concepts of probability.
4th Grade
-
Data Analysis and Probability
- Standard 4-6: The student will demonstrate through the mathematical processes an understanding of the impact of data-collection methods, the appropriate graph for categorical or numerical data, and the analysis of possible outcomes for a simple event.
5th Grade
-
Data Analysis & Probability
- The student will understand and apply basic statistical and probability concepts in order to organize and analyze data and to make predictions and conjectures.
6th Grade
-
Data Analysis & Probability
- Content Standard 5.0 The student will understand and apply basic statistical and probability concepts in order to organize and analyze data and to make predictions and conjectures.
7th Grade
-
Data Analysis & Probability
- The student will understand and apply basic statistical and probability concepts in order to organize and analyze data and to make predictions and conjectures.
8th Grade
-
Data Analysis & Probability
- The student will understand and apply basic statistical and probability concepts in order to organize and analyze data and to make predictions and conjectures.
3rd Grade
-
Data Analysis
- Content Standard 5.0 The student will understand and apply basic statistical and probability concepts in order to organize and analyze data and to make predictions and conjectures.
4th Grade
-
Data Analysis & Probability
- The student will understand and apply basic statistical and probability concepts in order to organize and analyze data and to make predictions and conjectures.
Grade 3
-
Probability and Statistics
- 13. The student solves problems by collecting, organizing, displaying, and interpreting sets of data.
Grade 4
-
Probability and Statistics
- 13. The student solves problems by collecting, organizing, displaying, and interpreting sets of data.
Grade 5
-
Probability and Statistics
- 13. The student solves problems by collecting, organizing, displaying, and interpreting sets of data.
Grade 6
-
Probability and Statistics
- 10. The student uses statistical representations to analyze data.
Grade 7
-
Probability and Statistics
- 11. The student understands that the way a set of data is displayed influences its interpretation.
Grade 8
-
Probability and Statistics
- 12. The student uses statistical procedures to describe data.
3rd Grade
-
Probability and Statistics
- 3.21b The student, given grid paper, will construct a line plot, a picture graph, or a bar graph to represent the results. Each graph will include an appropriate title and key.
4th Grade
-
Probability and Statistics
- 4.20 The student will collect, organize, and display data in line and bar graphs with scale increments of one or greater than one and use the display to interpret the results, draw conclusions, and make predictions.
5th Grade
-
Probability and Statistics
- 5.18 The student will, given a problem situation, collect, organize, and display a set of numerical data in a variety of forms, using bar graphs, stem-and-leaf plots, and line graphs, to draw conclusions and make predictions.
8th Grade
-
Probability and Statistics
- 8.12 The student will make comparisons, predictions, and inferences, using information displayed in frequency distributions; box-and-whisker plots; scattergrams; line, bar, circle, and picture graphs; and histograms.
6th Grade
-
Probability and Statistics
- 6.18a The student, given a problem situation, will collect, analyze, display, and interpret data in a variety of graphical methods, including line, bar, and circle graphs
Be Prepared to
- Encourage students to enter in their own data or be ready to give them examples of data to enter
- Explain how the scale can influence how the graph looks
- Discuss how graphs can be misleading
- Discuss the difference between categorical and quantitative data