What is Measures?
This activity allows the user to input various types of data and to request the following statistics for the data:
- Total is the sum of the measured quantity for the items.
- Mean is the Total divided by the number of items, also know as the average.
- Median is the number in the middle when the data is arranged in increasing order.
- Mode is the number that appears most frequently in the data. If there is more than one value that has the highest frequency then the data has more than one mode. If every number has the same frequency then there is no mode.
- Range is the difference between the largest number and the smallest number in the data.
- Variance describes how far the data is from the mean or, in other words, how well the mean represents the data. The variance is calculated by first subtracting the value of each item from the mean and squaring each result individually. Then, all the squared terms are added together and the total is divided by one less than the total number of items (or squared terms).
- Deviation is the average distance of each item from the line that best fits the data. This value is calculated by taking the square root of the Variance.
How Do I Use This Activity?
This activity allows the user to input various types of data and to request the following statistics for the data:
total
variance
mean
median
mode
range
variation
Controls and Output
-
On the first screen you must begin by entering information about the data that has been
collected.
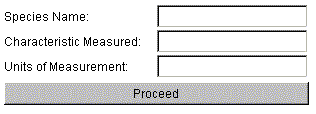
- In the first entry blank, enter the name of the species (or object) that you observed. You may have studied plants, cats, classmates, or school desks. Please enter this name in the singular form: plant, cat, desk, etc.
- You will then be required to enter the characteristic of the specimens that you measured. This is the aspect of the species that you observed such as height, sleep, age, or weight.
- In the last entry blank, you must supply the units of measurement that were used, such as feet, inches, hours, years, months, pounds, or kilograms.
-
After you have entered your information in the three spaces, click the Proceed button to continue.
-
On the second screen:
-
You will be asked to set the number of specimens that you observed. You may include
1-20 objects. If you choose less than 10 objects, the scrollbars on the next screen
will disappear. If you choose more than 20 objects, the total will automatically
change to 20 objects.
-
You must also enter a range of values within which your measurements fall. This range
should be in terms of the units that you entered on the first screen.
-
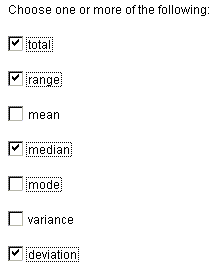
Before leaving this page you may choose the statistical information that you would like the program to calculate for you. You may choose more than one by clicking on the box to the left of each option. You must choose at least one option to proceed.
Please note that a checkmark may not appear in the box on your screen as shown here, but you should be able to observe which options have been chosen.
-
You will be asked to set the number of specimens that you observed. You may include
1-20 objects. If you choose less than 10 objects, the scrollbars on the next screen
will disappear. If you choose more than 20 objects, the total will automatically
change to 20 objects.
-
To proceed to the next screen, click the Proceed button at the bottom of the screen.
-
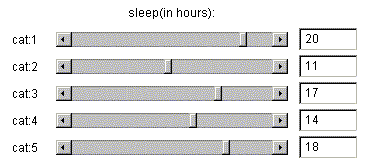
On the third screen you can enter the measurement for each specimen that you observed
using the scroll bars or the input fields. Note that you can only use values within the
range that you specified previously. If you have more than 10 objects and the scroll bars
are not visible, simply tab between the input fields to enter your information.
-
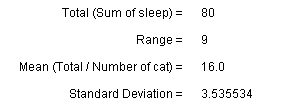
Below the adjustment area you may observe the statistical information you requested.
Notice the calculations change as you adjust your data.
-
To start over or enter a new data set, click on the
Get New Outputs button at the bottom of this screen.
Description
This applet allows the user to select the number and height of plants or to name a different item data have been collected about to experiment with to find the total height, mean, median, mode, range, variance, and deviation. This activity would work well in groups of 2 for about 20-25 minutes if you use the exploration questions and 15-20 minutes otherwise.
Place in Mathematics Curriculum
This activity can be used to:
- introduce and/or develop fractions
- develop the idea of averages, both through numerical and geometrical methods
- develop estimating skills
- introduce and/or reinforce the ideas of mean, median, and mode
- introduce and/or reinforce the ideas of variance and standard deviation
- develop recognition and understanding of data representations
Standards Addressed
Grade 6
-
Statistics and Probability
- The student demonstrates an ability to classify and organize data.
- The student demonstrates an ability to analyze data (comparing, explaining, interpreting, evaluating; drawing or justifying conclusions).
Grade 7
-
Statistics and Probability
- The student demonstrates an ability to classify and organize data.
- The student demonstrates an ability to analyze data (comparing, explaining, interpreting, evaluating, making predictions; drawing or justifying conclusions).
Grade 8
-
Statistics and Probability
- The student demonstrates an ability to classify and organize data.
- The student demonstrates an ability to analyze data (comparing, explaining, interpreting, evaluating, making predictions, describing trends; drawing, formulating, or justifying conclusions).
Grade 9
-
Statistics and Probability
- The student demonstrates an ability to classify and organize data.
- The student demonstrates an ability to analyze data (comparing, explaining, interpreting, evaluating, making predictions, describing trends; drawing, formulating, or justifying conclusions).
Grade 10
-
Statistics and Probability
- The student demonstrates an ability to classify and organize data.
- The student demonstrates an ability to analyze data (comparing, explaining, interpreting, evaluating, making predictions, describing trends; drawing, formulating, or justifying conclusions).
Statistics and Probability
-
Interpreting Categorical and Quantitative Data
- Summarize, represent, and interpret data on a single count or measurement variable
Grades 3-5
-
Data Analysis and Probability
- Select and use appropriate statistical methods to analyze data
Grades 6-8
-
Data Analysis and Probability
- Select and use appropriate statistical methods to analyze data
Grades 9-12
-
Data Analysis and Probability
- Formulate questions that can be addressed with data and collect, organize, and display relevant data to answer them
Grade 7
-
Number and Operations, Measurement, Geometry, Data Analysis and Probability, Algebra
- COMPETENCY GOAL 4: The learner will understand and use graphs and data analysis.
Advanced Functions and Modeling
-
Data Analysis and Probability
- Competency Goal 1: The learner will analyze data and apply probability concepts to solve problems.
AP Statistics
-
Number and Operations
- Competency Goal 1: The learner will analyze univariate data to solve problems.
3rd Grade
-
Data Analysis and Probability
- The student will demonstrate through the mathematical processes an understanding of organizing, interpreting, analyzing and making predictions about data, the benefits of multiple representations of a data set, and the basic concepts of probability.
6th Grade
-
Data Analysis and Probability
- The student will demonstrate through the mathematical processes an understanding of the relationships within one population or sample.
5th Grade
-
Data Analysis and Probability
- The student will demonstrate through the mathematical processes an understanding of investigation design, the effect of data-collection methods on a data set, the interpretation and application of the measures of central tendency, and the application of b
- The student will demonstrate through the mathematical processes an understanding of investigation design, the effect of data-collection methods on a data set, the interpretation and application of the measures of central tendency, and the application of basic concepts of probability.
8th Grade
-
Data Analysis and Probability
- The student will demonstrate through the mathematical processes an understanding of the relationships between two variables within one population or sample.
5th Grade
-
Data Analysis & Probability
- The student will understand and apply basic statistical and probability concepts in order to organize and analyze data and to make predictions and conjectures.
4th Grade
-
Data Analysis & Probability
- The student will understand and apply basic statistical and probability concepts in order to organize and analyze data and to make predictions and conjectures.
7th Grade
-
Probability and Statistics
- 7.16 The student will create and solve problems involving the measures of central tendency (mean, median, mode) and the range of a set of data.
5th Grade
-
Probability and Statistics
- 5.19 The student will find the mean, median, mode, and range of a set of data.
8th Grade
-
Patterns, Functions, and Algebra
- 8.18 The student will use the following algebraic terms appropriately: domain, range, independent variable, and dependent variable.
- 8.18 The student will use the following algebraic terms appropriately: domain, range,
Textbooks Aligned
6th
-
Module 4 - Statistical Safari
- Section 2: Line Plots and Averages
8th
-
Module 1 - Amazing Feats and Facts and Fiction
- Section 2: Displaying Data


