What is Multi Bar Graph?
The Multiple Bar Graph applets allow the user to graphically display several data frequencies using multiple bar graph. This particular applet allows the user to enter his/her own data as well as manipulate the y-axis values. The ability to manipulate the y-axis values allows the creation of potentially misleading graphs.
Bar graphs similarly to histograms are graphical data representations based on frequency. Histograms are a type of bar graph. The feature which distinguishes a histogram from a bar graph is that the each bar on a histogram represents a range of data, where each bar on a bar graph represents a specific category. For example:
In this bar graph each pair of bars represents a year and each bar represents either Europe or Asia, while the y-axis shows the population in millions.
References for data sets:
- Households with Computer and Internet in 2005 is from the U.S. Census Bureau, 2005.
- Education Levels is from the US Census Bureau, 2009.
- Starbucks and McDonalds is from Starbucks.com and McDonalds.com
- Population of Europe and Asia in Hundreds of Thousands is from the United Nations Population Division, 2007.
How Do I Use This Activity?
This activity allows the user to graph data sets in multiple bar graphs. The color, thickness, and scale of the graph are adjustable. Users may input their own data, or use or alter pre-made data sets.
Controls and Output
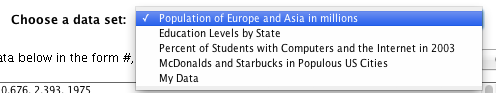
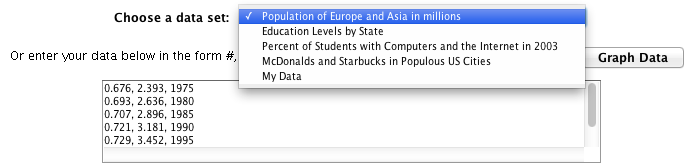
The user may choose from a set of pre-made data sets about daily activity, coin tosses, government spending, and more. The choice menu shown below has the pre-made data sets.
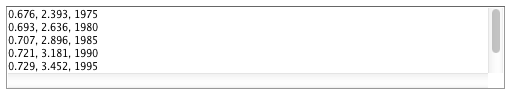
The user may change the amount, or name of a value being graphed. The data must be in the following format:
Value 1, Value 2, Name
for example:
0.676, 2.393, 1975
The data may be edited in the data box shown below.
The data may be updated after being changed, or cleared from the data box by pressing the "Update Chart" and "Clear" button, both shown below.

- The user may manually adjust the Y scale of the bar graph by dragging the vertical scrollbar next to the graph. The thickness of the bars may be altered by dragging the scrollbar on the X axis.
-
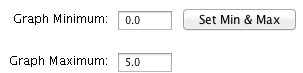
To change the scale of the graph to a specific value, the user may enter Maximum and
Minimum Y scale values in the Number Inputs, and click the "Set Min and Max" button, all
shown below.
- To change the color of the bars, the user may select a color from the Bar Color drop down choice menu.
-
Pre-made data sets may be selected from a choice menu. To alter the data, the user may
change the data displayed in the data box below the choice menu, and hit the "Graph Data"
button. To clear all data, the user may hit the "Clear Data" button. The choice menu, data
box with data, and the two buttons are shown below.
Description
This activity allows the user to graph data on a bar graph using a java applet. Students can use predefined data sets or enter their own data. Users can also change graph properties such as the scale and the color of the bars. This activity would work well in small groups of 3-4 for about 25-30 minutes if you use the exploration questions and 15-20 minutes otherwise.
Place in Mathematics Curriculum
This activity can be used to:
- Demonstrate the idea of a multiple bar graph
- Create multiple bar graphs
- Give students practice in reading multiple bar graphs
- Display the purpose of visual representations of data
Standards Addressed
Grade 6
-
Statistics and Probability
- The student demonstrates an ability to classify and organize data.
- The student demonstrates an ability to analyze data (comparing, explaining, interpreting, evaluating; drawing or justifying conclusions).
Grade 7
-
Statistics and Probability
- The student demonstrates an ability to classify and organize data.
- The student demonstrates an ability to analyze data (comparing, explaining, interpreting, evaluating, making predictions; drawing or justifying conclusions).
Grade 8
-
Statistics and Probability
- The student demonstrates an ability to classify and organize data.
- The student demonstrates an ability to analyze data (comparing, explaining, interpreting, evaluating, making predictions, describing trends; drawing, formulating, or justifying conclusions).
Grade 9
-
Statistics and Probability
- The student demonstrates an ability to classify and organize data.
- The student demonstrates an ability to analyze data (comparing, explaining, interpreting, evaluating, making predictions, describing trends; drawing, formulating, or justifying conclusions).
Grade 10
-
Statistics and Probability
- The student demonstrates an ability to classify and organize data.
- The student demonstrates an ability to analyze data (comparing, explaining, interpreting, evaluating, making predictions, describing trends; drawing, formulating, or justifying conclusions).
Third Grade
-
Measurement and Data
- Represent and interpret data.
Fourth Grade
-
Measurement and Data
- Represent and interpret data.
Eighth Grade
-
Statistics and Probability
- Investigate patterns of association in bivariate data.
Statistics and Probability
-
Interpreting Categorical and Quantitative Data
- Summarize, represent, and interpret data on a single count or measurement variable
Grades 6-8
-
Data Analysis and Probability
- Formulate questions that can be addressed with data and collect, organize, and display relevant data to answer them
- Select and use appropriate statistical methods to analyze data
Grades 9-12
-
Data Analysis and Probability
- Formulate questions that can be addressed with data and collect, organize, and display relevant data to answer them
Grade 7
-
Number and Operations, Measurement, Geometry, Data Analysis and Probability, Algebra
- COMPETENCY GOAL 4: The learner will understand and use graphs and data analysis.
Grade 8
-
Number and Operations, Measurement, Geometry, Data Analysis and Probability, Algebra
- COMPETENCY GOAL 4: The learner will understand and use graphs and data analysis.
Introductory Mathematics
-
Algebra
- COMPETENCY GOAL 4: The learner will understand and use graphs and data analysis.
-
Data Analysis and Probability
- COMPETENCY GOAL 3: The learner will understand and use graphs and data analysis.
Advanced Functions and Modeling
-
Data Analysis and Probability
- Competency Goal 1: The learner will analyze data and apply probability concepts to solve problems.
Integrated Mathematics
-
Data Analysis and Probability
- Competency Goal 3: The learner will analyze data and apply probability concepts to solve problems.
AP Statistics
-
Data Analysis and Probability
- Competency Goal 3: The learner will collect and analyze data to solve problems.
-
Number and Operations
- Competency Goal 1: The learner will analyze univariate data to solve problems.
Grade 6
-
Probability and Statistics
- 10. The student uses statistical representations to analyze data.
Grade 7
-
Probability and Statistics
- 11. The student understands that the way a set of data is displayed influences its interpretation.
Grade 8
-
Probability and Statistics
- 12. The student uses statistical procedures to describe data.
Be Prepared to
- Encourage students to enter in their own data or be ready to give them examples of data to enter
- Explain how the scale can influence how the graph looks
- Discuss how graphs can be misleading
- Discuss the difference between categorical and quantitative data