What is Histogram?
This activity allows the user to view and make their own histograms.
A histogram is defined as a bar graph that shows frequency data. The first step in making a histogram is to collect data and sort it into categories. To continue, you must label the data as the independent set or the dependent set. The characteristic you grouped the data by would be the independent variable and the frequency of that set would be the dependent variable.
Now you must draw a graph and label it. The horizontal axis should be labeled with the independent variable and the vertical axis should be labeled with the dependent variable. Each mark on either axis should be in equal increments, such as 2,4,6,8,etc. Now you are ready to plot your data. For each category find the related frequency and make horizontal marks to show the frequency. Now that you are done graphing you can easily look at it and see what occurs more often and what doesn't.
How Do I Use This Activity?
This activity allows users to view and make their own histograms.
Controls and Output
-
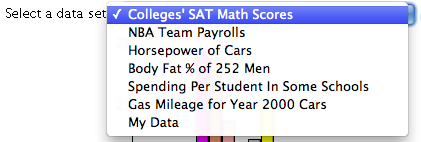
You can choose the data to be graphed from a list of existing data sets by choosing from
the drop down menu, or you can choose "My Data" and enter your own data in the text box at
the bottom of the applet.
-
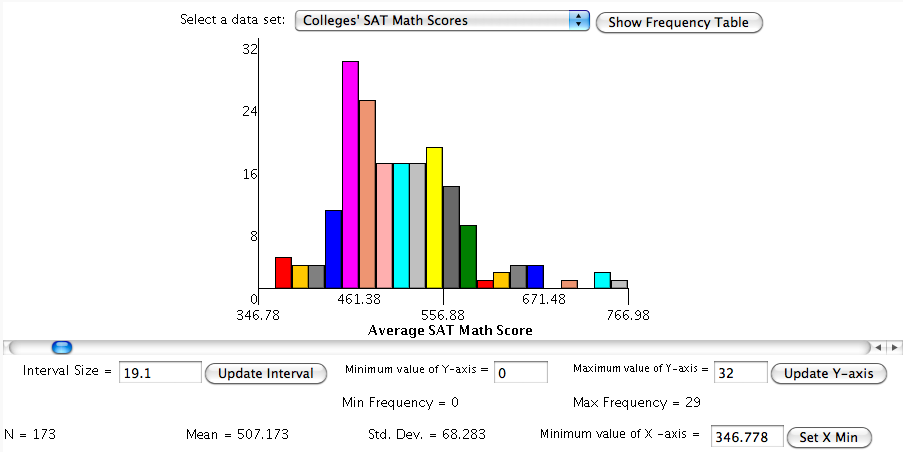
The histogram will look something like the image below. The height of each bar corresponds
to the number of data points in the interval represented by that bar. The scrollbar below
the histogram allows you to change the interval size. A label below the scrollbar displays
the current interval size. You can also change the interval size manually by inputting a
number into the
Interval Size and clicking on the
Update Interval button.
-
You can change the values displayed on the vertical axis by setting the
Minimum value of Y-axis and
Maximum value of Y-axis. Click the
Update Y-axis button to make the changes to these values take effect.
-
As you change the interval size, the values displayed as
Min Frequency and
Max Frequency may change also. If the minimum value of the Y-axis is set so that it is less than the
Min Frequency value, any interval in which the height of the bar is smaller than the
minimum value of the Y-axis will appear to be empty.
- Just above the text box, the number of data points will be displayed as N. Next to that will be the Mean and Standard Deviation of the data. You can set the minimum value of the horizontal axis in the text box labeled Minimum value of X-axis. After entering the desired value, press the Set X Min button to update the graph.
-
The following data sets can be used with the histogram activity:
-
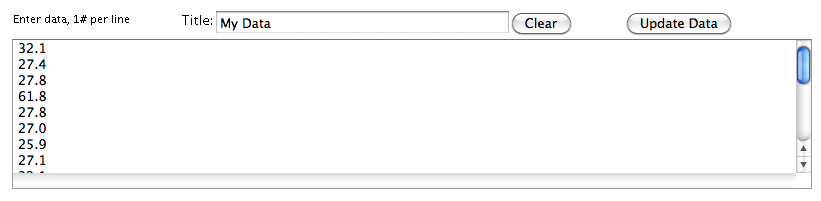
If you select "My Data" from the list beside
Select a data set, you must input the data you want to use at the bottom of the applet. Beside the words
Title you may write a description of your data that will appear below the graph. The data you
want to graph should go in the
data input box beneath the words "Enter data, 1# per line". Numbers in this text box should be one per
line. Click
Clear to clear out the
data input box and click the
Update Data button to have the histogram reflect changes in the data entered into the data text box.
-
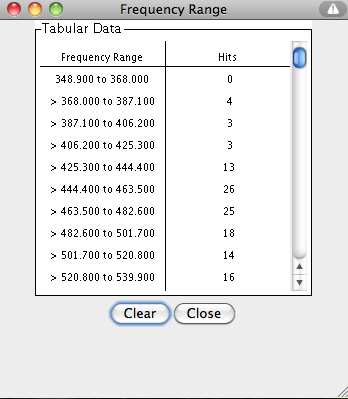
Pressing the
Show Frequency Table button shows a frequency table of the number of hits for each interval within the
histogram.
 This window will automatically close if the interval size changes and must be reopened
when the new interval size is established.
This window will automatically close if the interval size changes and must be reopened
when the new interval size is established.
Description
This activity allows the user to view and make their own histograms. A histogram is defined as a bar graph that shows frequency data. This activity would work well in same ability groups of two to four for about twenty minutes if you use the exploration questions and five to ten minutes otherwise.
Place in Mathematics Curriculum
This activity can be used to:
- illustrate the idea of averages, both through numerical and geometrical methods
- develop estimating skills
- introduce the idea of a histogram
- practice students skills at reading histograms
- give students insight into drawing histograms that illustrate a data set well
- develop recognition and understanding of data representations
Standards Addressed
Grade 6
-
Statistics and Probability
- The student demonstrates an ability to classify and organize data.
- The student demonstrates an ability to analyze data (comparing, explaining, interpreting, evaluating; drawing or justifying conclusions).
Grade 7
-
Statistics and Probability
- The student demonstrates an ability to classify and organize data.
- The student demonstrates an ability to analyze data (comparing, explaining, interpreting, evaluating, making predictions; drawing or justifying conclusions).
Grade 8
-
Statistics and Probability
- The student demonstrates an ability to classify and organize data.
- The student demonstrates an ability to analyze data (comparing, explaining, interpreting, evaluating, making predictions, describing trends; drawing, formulating, or justifying conclusions).
Grade 9
-
Statistics and Probability
- The student demonstrates an ability to classify and organize data.
- The student demonstrates an ability to analyze data (comparing, explaining, interpreting, evaluating, making predictions, describing trends; drawing, formulating, or justifying conclusions).
Grade 10
-
Statistics and Probability
- The student demonstrates an ability to classify and organize data.
- The student demonstrates an ability to analyze data (comparing, explaining, interpreting, evaluating, making predictions, describing trends; drawing, formulating, or justifying conclusions).
Third Grade
-
Measurement and Data
- Represent and interpret data.
Fourth Grade
-
Measurement and Data
- Represent and interpret data.
Fifth Grade
-
Measurement and Data
- Represent and interpret data.
Statistics and Probability
-
Interpreting Categorical and Quantitative Data
- Summarize, represent, and interpret data on a single count or measurement variable
Grades 6-8
-
Data Analysis and Probability
- Formulate questions that can be addressed with data and collect, organize, and display relevant data to answer them
- Select and use appropriate statistical methods to analyze data
Grades 9-12
-
Data Analysis and Probability
- Develop and evaluate inferences and predictions that are based on data
- Formulate questions that can be addressed with data and collect, organize, and display relevant data to answer them
- Select and use appropriate statistical methods to analyze data
Grade 7
-
Number and Operations, Measurement, Geometry, Data Analysis and Probability, Algebra
- COMPETENCY GOAL 4: The learner will understand and use graphs and data analysis.
Grade 8
-
Number and Operations, Measurement, Geometry, Data Analysis and Probability, Algebra
- COMPETENCY GOAL 4: The learner will understand and use graphs and data analysis.
Introductory Mathematics
-
Algebra
- COMPETENCY GOAL 4: The learner will understand and use graphs and data analysis.
-
Data Analysis and Probability
- COMPETENCY GOAL 3: The learner will understand and use graphs and data analysis.
Advanced Functions and Modeling
-
Data Analysis and Probability
- Competency Goal 1: The learner will analyze data and apply probability concepts to solve problems.
Integrated Mathematics
-
Data Analysis and Probability
- Competency Goal 3: The learner will analyze data and apply probability concepts to solve problems.
AP Statistics
-
Geometry and Measurement
- Competency Goal 2: The learner will construct and interpret displays of univariate data to solve problems.
-
Number and Operations
- Competency Goal 1: The learner will analyze univariate data to solve problems.
Grade 6
-
Probability and Statistics
- 10. The student uses statistical representations to analyze data.
Grade 7
-
Probability and Statistics
- 11. The student understands that the way a set of data is displayed influences its interpretation.
Grade 8
-
Probability and Statistics
- 12. The student uses statistical procedures to describe data.
Textbooks Aligned
Grade Six
-
Data About Us
- Investigation One: Looking at Data
- Investigation Two: Types of Data
Book 1
-
Module 3 - Statistical Safari
- Section 4: Mean, Median, Mode, Averages
Book 2
-
Module 1 - Making Choices
- Section 1: Bar Graphs, Line Graphs
- Section 1: Tallying Data
-
Module 5 - Recreation
- Section 1: Ratios
- Section 1: Proportions
- Section 1: Stem-and-Leaf Plots
- Section 1: Histograms
-
Module 7 - Health and Wellness
- Section 4: Circle Graphs
Book 3
-
Module 8 - Making an Impact
- Section 2: Circle Graphs
- Section 2: Histograms
- Section 3: Misleading Graphs
7th
-
Module 5 - Recreation
- Section 2: Surveys and Data Displays
8th
-
Module 1 - Amazing Feats and Facts and Fiction
- Section 1: Rates and Data Displays
- Section 2: Displaying Data
Book 1
-
What Does the Data Say?
- Lesson 4: Animal Comparisons
- Lesson 5: Double Data
- Lesson 6: Across the Ages
Grade 8
-
Insights into Data
- Understanding Graphs
- Gathering Data
- Bias
- Representation of Data
- Correlations
- Scatter Plots
- Box Plots
Grade 5
-
Picturing Numbers
- Bar Graphs
- Line Graphs
- Pie Charts
- Pictographs
- Describing Data
- Using Data for Arguments
-
Taking A Chance
- Fairness
- Estimating and Computing Chance
- Tree Diagrams
Grade 6
-
Dealing With Data
- Scatter Plots
- Box Plots
- Stem and Leaf Plot
- Histograms
- Mean, Median, Mode and Range
-
Tracking Graphs
- Line Graphs
- Interpreting Graphs
- Looking at a Graph's global features
Grade 7
-
Decision Making
- Graphs of Data
- Constraints
- Graphing Inequalities
- Discrete Functions
-
Statistics and the Environment
- Collecting Data
- Mean, Median, Mode and Range
- Maps
- Graphs and Tables
Be Prepared to
- answer the question "How do I draw a histogram by hand?"
- discuss mean, class interval, and misleading graphs