What is Plop It!?
This activity allows the user to experiment with mean, median, and mode by using a bar graph.
Mean, median, and mode are all measures of center. This applet allows you to visually see what the difference is between them.
- Mean is the sum of a list of values, divided by the total number of values in the list. Most simply put, the mean is the average.
- Median is the smallest number such that at least half the numbers in the list are no greater than it. If the list has an odd number of entries, the median is the middle entry in the list after sorting the list into increasing order. If the list has an even number of entries, the median is equal to the sum of the two middle (after sorting) numbers divided by two. Most simply put, the median is the value in the middle.
- Mode is the most frequently occurring value. If there is more than one value that has the highest frequency the data has more than one mode. If every number has the same frequency then the data has no mode.
How Do I Use This Activity?
This activity allows the user to explore the concepts of mean, median, and mode by adding/removing blocks to an axis with a given range.
Controls and Output
-
Click above the horizontal axis to place blocks. The blocks appear in that respective
column.
-
When adding blocks pointers appear indicating the respective measure of central tendency.
When adding blocks, the pointers move to indicate the new values for those statistics.
-
By clicking the appropriate radio button below the words
When I click:, the user can change whether the blocks are added or removed from the column. The user
can also choose to drag a box by choosing the "drag box" radio button and click and drag
one of the boxes. This is discussed in further detail below.
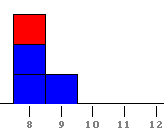
When dragging a box to change one of the data points, click and drag the top box in a column for which you wish to change. The box will change from blue to red to indicate which box is being manipulated. Drag the box right or left and release the mouse when it appears in the column you want. Note the values in the text box as well as the pointers for mean, median, and mode also dynamically update as the box is dragged. Pictured below is a box before dragging and after dragging.
-
Increase or decrease the x axis or y axis range of values by clicking on one of the
following buttons. Note the x axis range has a maximum range of 30 consecutive values and
the y axis range can have a maximum of 24.

-
The user can change the interval of the range by altering the
X-Range Starts At value and then clicking the
Set button. To reset the entire program to the default values, click
Reset.
-
To see the statistical information in text, click the
Show Stats button. The statistics panel (shown below) will appear at the bottom of the applet. When
the statistics panel is visible, the
Show Stats button will change to the
Hide Stats. Click that button to hide the statistics panel again.
-
The user can also enter data to be plotted by typing it in the text area in the middle of
the applet. Each number should be an integer and should be separated by a comma, a space,
or by pressing the enter key. Type the data you want to use, and then click
Update Graph to plot your data. Click
Clear to clear all the data from the text area.
Description
This activity allows the user to experiment with mean, median, and mode by using a bar graph. This activity would work well in groups of two or three for about twenty-five to thirty minutes if you use the exploration questions and five to ten minutes otherwise.
Place in Mathematics Curriculum
This activity can be used to:
- introduce and reinforce the concepts of mean, median, and mode
Standards Addressed
Grade 3
-
Statistics and Probability
- The student demonstrates an ability to classify and organize data.
- The student demonstrates an ability to analyze data (comparing, explaining, interpreting, or justifying conclusions).
Grade 4
-
Statistics and Probability
- The student demonstrates an ability to classify and organize data.
- The student demonstrates an ability to analyze data (comparing, explaining, interpreting, evaluating; drawing or justifying conclusions).
Grade 5
-
Statistics and Probability
- The student demonstrates an ability to classify and organize data.
- The student demonstrates an ability to analyze data (comparing, explaining, interpreting, evaluating; drawing or justifying conclusions).
Grade 6
-
Statistics and Probability
- The student demonstrates an ability to classify and organize data.
- The student demonstrates an ability to analyze data (comparing, explaining, interpreting, evaluating; drawing or justifying conclusions).
Grade 7
-
Statistics and Probability
- The student demonstrates an ability to classify and organize data.
- The student demonstrates an ability to analyze data (comparing, explaining, interpreting, evaluating, making predictions; drawing or justifying conclusions).
Grade 8
-
Statistics and Probability
- The student demonstrates an ability to classify and organize data.
- The student demonstrates an ability to analyze data (comparing, explaining, interpreting, evaluating, making predictions, describing trends; drawing, formulating, or justifying conclusions).
Grade 9
-
Statistics and Probability
- The student demonstrates an ability to classify and organize data.
- The student demonstrates an ability to analyze data (comparing, explaining, interpreting, evaluating, making predictions, describing trends; drawing, formulating, or justifying conclusions).
Grade 10
-
Statistics and Probability
- The student demonstrates an ability to classify and organize data.
- The student demonstrates an ability to analyze data (comparing, explaining, interpreting, evaluating, making predictions, describing trends; drawing, formulating, or justifying conclusions).
Fourth Grade
-
Measurement and Data
- Represent and interpret data.
Fifth Grade
-
Measurement and Data
- Represent and interpret data.
Sixth Grade
-
Statistics and Probability
- Develop understanding of statistical variability.
- Summarize and describe distributions.
Statistics and Probability
-
Interpreting Categorical and Quantitative Data
- Summarize, represent, and interpret data on a single count or measurement variable
Grades 3-5
-
Data Analysis and Probability
- Select and use appropriate statistical methods to analyze data
Grades 6-8
-
Data Analysis and Probability
- Formulate questions that can be addressed with data and collect, organize, and display relevant data to answer them
- Select and use appropriate statistical methods to analyze data
Grades 9-12
-
Data Analysis and Probability
- Formulate questions that can be addressed with data and collect, organize, and display relevant data to answer them
- Select and use appropriate statistical methods to analyze data
Grade 4
-
Number and Operations, Measurement, Geometry, Data Analysis and Probability, Algebra
- COMPETENCY GOAL 4: The learner will understand and use graphs, probability, and data analysis.
Grade 5
-
Number and Operations, Measurement, Geometry, Data Analysis and Probability, Algebra
- COMPETENCY GOAL 4: The learner will understand and use graphs and data analysis.
Grade 7
-
Number and Operations, Measurement, Geometry, Data Analysis and Probability, Algebra
- COMPETENCY GOAL 4: The learner will understand and use graphs and data analysis.
Grade 8
-
Number and Operations, Measurement, Geometry, Data Analysis and Probability, Algebra
- COMPETENCY GOAL 4: The learner will understand and use graphs and data analysis.
Introductory Mathematics
-
Algebra
- COMPETENCY GOAL 4: The learner will understand and use graphs and data analysis.
-
Data Analysis and Probability
- COMPETENCY GOAL 3: The learner will understand and use graphs and data analysis.
Advanced Functions and Modeling
-
Data Analysis and Probability
- Competency Goal 1: The learner will analyze data and apply probability concepts to solve problems.
Integrated Mathematics
-
Data Analysis and Probability
- Competency Goal 3: The learner will analyze data and apply probability concepts to solve problems.
AP Statistics
-
Number and Operations
- Competency Goal 1: The learner will analyze univariate data to solve problems.
6th Grade
-
Data Analysis and Probability
- The student will demonstrate through the mathematical processes an understanding of the relationships within one population or sample.
5th Grade
-
Data Analysis and Probability
- The student will demonstrate through the mathematical processes an understanding of investigation design, the effect of data-collection methods on a data set, the interpretation and application of the measures of central tendency, and the application of basic concepts of probability.
8th Grade
-
Data Analysis and Probability
- The student will demonstrate through the mathematical processes an understanding of the relationships between two variables within one population or sample.
5th Grade
-
Data Analysis & Probability
- The student will understand and apply basic statistical and probability concepts in order to organize and analyze data and to make predictions and conjectures.
6th Grade
-
Data Analysis & Probability
- Content Standard 5.0 The student will understand and apply basic statistical and probability concepts in order to organize and analyze data and to make predictions and conjectures.
7th Grade
-
Data Analysis & Probability
- The student will understand and apply basic statistical and probability concepts in order to organize and analyze data and to make predictions and conjectures.
8th Grade
-
Data Analysis & Probability
- The student will understand and apply basic statistical and probability concepts in order to organize and analyze data and to make predictions and conjectures.
4th Grade
-
Data Analysis & Probability
- The student will understand and apply basic statistical and probability concepts in order to organize and analyze data and to make predictions and conjectures.
Grade 7
-
Probability and Statistics
- 12. The student uses measures of central tendency and variability to describe a set of data.
Grade 8
-
Probability and Statistics
- 12. The student uses statistical procedures to describe data.
7th Grade
-
Probability and Statistics
- 7.16 The student will create and solve problems involving the measures of central tendency (mean, median, mode) and the range of a set of data.
5th Grade
-
Probability and Statistics
- 5.19 The student will find the mean, median, mode, and range of a set of data.
6th Grade
-
Probability and Statistics
- 6.19 The student will describe the mean, median, and mode as measures of central tendency, describe the range, and determine their meaning for a set of data.
Textbooks Aligned
Grade Six
-
Data About Us
- Investigation Five: What Do We Mean by Mean?
8th
-
Module 1 - Amazing Feats and Facts and Fiction
- Section 2: Displaying Data
Be Prepared to
- answer the question "How are there three ways to measure the center? Is one way better than the other?
- discuss mean, median, and mode