What is Normal Distribution?
This applet allows the user to experiment with the normal distribution, varying the standard deviation.
Continuous distributions such as the normal distribution and the lognormal distribution, as well as others like the exponential distribution which are not shown here, occur as the number of trials in an experiment increases toward infinity. That is to say, if you take several measurements over and over again, for years, the histogram you get will start to look more and more like a smooth curve.
A scientist sees normal distributions frequently. In any value where there can be measurement error, like a height, a weight, or a pH, you can make a histogram of the results of your trials. If you do enough trials, as scientists sometimes do, you will start to see a normal distribution. If you measure many similar things, which have differences caused by a random variation, those results will be in a normal distribution. Examples include the heights of cornstalks in a field, the levels of a chemical like iron in different people's blood, or standardized test scores. Also, when multiple probabilities interact (like a game where you roll two dice) you get a histogram resembling a normal distribution.
How Do I Use This Activity?
This activity allows the user to experiment with continuous or many-trial distributions where the mean, median, and mode are the same.
Controls and Output
-
The
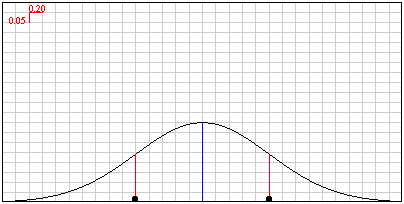
Graph shows a normal distribution. The
mean is indicated by a blue line and the
standard deviation is indicated by a red line on either side of the mean. The black circles at the bottom of
the red lines can be dragged with the mouse to change the standard deviation. The
maximum standard deviation is 1.25. The red graphic in the upper-left corner gives the scale of the grid.
-
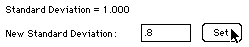
You can also set the standard deviation by typing a new value in the box marked
New Standard Deviation and clicking the
Set button. The current standard deviation is printed in the label just below the graph.
-
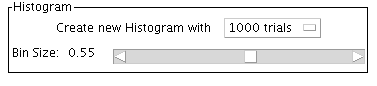
To draw a histogram, choose the number of trials you want from the choices in the
pull-down menu. You can change the bin size using the scrollbar.
Description
This activity allows the user to experiment with continuous or many-trial distributions where the mean, median, and mode are the same. This activity would work well in mixed ability groups of two to four for about twenty-five minutes to thirty if you use the exploration questions and five to ten minutes otherwise.
Place in Mathematics Curriculum
This activity can be used to:
- reinforce graphically the concepts of median and standard deviation
- demonstrate the difference between theoretical (infinite-trial) and actual (small or large sample)
Standards Addressed
Grade 6
-
Statistics and Probability
- The student demonstrates an ability to classify and organize data.
- The student demonstrates an ability to analyze data (comparing, explaining, interpreting, evaluating; drawing or justifying conclusions).
Grade 7
-
Statistics and Probability
- The student demonstrates an ability to classify and organize data.
- The student demonstrates an ability to analyze data (comparing, explaining, interpreting, evaluating, making predictions; drawing or justifying conclusions).
Grade 8
-
Statistics and Probability
- The student demonstrates an ability to classify and organize data.
- The student demonstrates an ability to analyze data (comparing, explaining, interpreting, evaluating, making predictions, describing trends; drawing, formulating, or justifying conclusions).
Grade 9
-
Statistics and Probability
- The student demonstrates an ability to classify and organize data.
- The student demonstrates an ability to analyze data (comparing, explaining, interpreting, evaluating, making predictions, describing trends; drawing, formulating, or justifying conclusions).
Grade 10
-
Statistics and Probability
- The student demonstrates an ability to classify and organize data.
- The student demonstrates an ability to analyze data (comparing, explaining, interpreting, evaluating, making predictions, describing trends; drawing, formulating, or justifying conclusions).
Sixth Grade
-
Statistics and Probability
- Develop understanding of statistical variability.
- Summarize and describe distributions.
Statistics and Probability
-
Interpreting Categorical and Quantitative Data
- Summarize, represent, and interpret data on a single count or measurement variable
Grades 9-12
-
Data Analysis and Probability
- Develop and evaluate inferences and predictions that are based on data
- Formulate questions that can be addressed with data and collect, organize, and display relevant data to answer them
- Select and use appropriate statistical methods to analyze data
Advanced Functions and Modeling
-
Data Analysis and Probability
- Competency Goal 1: The learner will analyze data and apply probability concepts to solve problems.
AP Statistics
-
Geometry and Measurement
- Competency Goal 2: The learner will construct and interpret displays of univariate data to solve problems.
-
Number and Operations
- Competency Goal 1: The learner will analyze univariate data to solve problems.
3rd Grade
-
Data Analysis and Probability
- The student will demonstrate through the mathematical processes an understanding of organizing, interpreting, analyzing and making predictions about data, the benefits of multiple representations of a data set, and the basic concepts of probability.
Be Prepared to
- answer the question "What makes a distribution normal?"
- discuss sample size and its effects on the result of an experiment