What is Skew Distribution?
This activity allows the user to experiment with moving the median away from the mean in a continuous distribution.
Continuous distributions such as the normal distribution and the lognormal distribution, as well as others like the exponential distribution which are not shown here, occur as the number of trials in an experiment increases toward infinity. That is if you keep measuring, the height of plants over and over again, for a whole field of plants, for years, the resulting histogram will start to look more and more like a smooth curve.
In most cases measurement of natural occurrences gives a normal distribution but not always. The mean, median, and mode can occasionally be different, especially when working with small data sets. Usually when working with large data sets obtained from natural occurances the distribution is normal but there are situations when the data set is large and the mean, median, and mode are different.
When the median, mean, and mode aren't the same, you have something called a "skew distribution". This applet lets you explore what some different skew distributions can look like.
If you measure the time it takes your class to run a lap around a track, or weigh a lot of different objects, or measure the heights of many different plants, or something else where all the data are positive numbers, but not constrained much more than that, you'll see a skew distribution. In the case of running the lap, maybe it takes the middle person three minutes. Some people will be faster, but a lot more people will make it around the track in five minutes or more, than those who will finsih in one minute or less. Somebody might take seven minutes, but nobody could finish in -1 minute. So distribution curve will be asymmetrical. Instead of someone being as likely to finish in two minutes less as two minutes more than the average, it might be as likely to get done in half the average time as twice the average time. Similarly, if you plotted the grades in your class, nobody can make better than a perfect score, but there are a lot of people who got scores near to perfect and then fewer and fewer people who got lower and lower grades.
Notes to the Teacher on the Lognormal Distribution
The normal curve has a single shape, essentially, though it can be taller and thinner or shorter and fatter, or it can move left or right along the x-axis. Unlike the normal distribution, the lognormal is considered to be a family of distributions rather than a single one with variable parameters. The lognormal can have much more variation in shape -- it can skew as well. There are many skewed distributions from many families that have the same median and standard deviation. I chose the lognormal because it matches up visually with the normal, is computationally simpler than many other distributions, and is often used in data analysis similar to those where a normal curve might be used. The curve the applet draws is only one of many possibilities.
The lognormal has only positive values, and the bulge is always on the low side... Each value of median-mean difference (actually the value 'median' accepts) has an associated mean, median, and skewness when associated with a given standard deviation -- it really doesn't have any more 'freedom' than the normal curve, because the change of shape is directly linked to change in location. I mirrored it to give the appearance of negative skewness if the median was moved above the mean, and shifted it to make it sit in the right place (with the mean at zero). What I did was NOT to make an accurate representation of the log normal curve, but to show a kind of distribution which might appear in a real situation where a compounding factor was affecting a normally-distributed variable. It looks trivial and purely mathematical, but I attempted to adhere to science, in which these things are possible, rather than pure math.
How Do I Use This Activity?
This activity allows the user to experiment with moving the median away from the mean in a continuous distribution.
Controls and Output
-
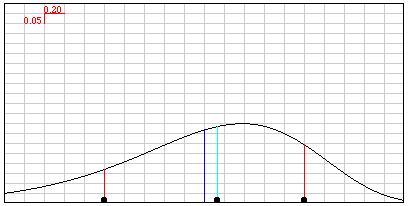
The
Graph shows a normal distribution. The
mean is indicated by a blue line, the
median by a light blue line, and the
standard deviation is indicated by a red line on either side of the mean. The black circles at the bottom of
the red lines and the light blue line can be dragged with the mouse to change the standard
deviation and the median. Note that the blue line will not be visible if the light blue
line is moved to the same place. The red graphic in the upper-left corner gives the scale
of the grid.
-
You can also set the standard deviation by typing a new value in the box marked
New Standard Deviation and clicking the
Set button. The current standard deviation is printed in the label just below the graph. The
median can be changed the same way, with the
New Median box.

-
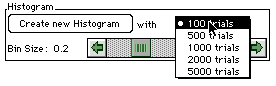
To draw a histogram, choose the number of trials you want from the choices in the
pull-down menu and click the
Create New Histogram button. You can change the bin size using the scrollbar.
Description
This activity allows the user to experiment with continuous or many-trial distributions where the mean, median, and mode are not the same. This activity would work well in mixed ability groups of two to four for about twenty to twenty-five minutes if you use the exploration questions and five to ten minutes otherwise.
Place in Mathematics Curriculum
This activity can be used to:
- reinforce graphically the concepts of median and standard deviation
- demonstrate the difference between theoretical (infinite-trial) and actual (small or large sample) data
Standards Addressed
Grade 6
-
Statistics and Probability
- The student demonstrates an ability to classify and organize data.
- The student demonstrates an ability to analyze data (comparing, explaining, interpreting, evaluating; drawing or justifying conclusions).
Grade 7
-
Statistics and Probability
- The student demonstrates an ability to classify and organize data.
- The student demonstrates an ability to analyze data (comparing, explaining, interpreting, evaluating, making predictions; drawing or justifying conclusions).
Grade 8
-
Statistics and Probability
- The student demonstrates an ability to classify and organize data.
- The student demonstrates an ability to analyze data (comparing, explaining, interpreting, evaluating, making predictions, describing trends; drawing, formulating, or justifying conclusions).
Grade 9
-
Statistics and Probability
- The student demonstrates an ability to classify and organize data.
- The student demonstrates an ability to analyze data (comparing, explaining, interpreting, evaluating, making predictions, describing trends; drawing, formulating, or justifying conclusions).
Grade 10
-
Statistics and Probability
- The student demonstrates an ability to classify and organize data.
- The student demonstrates an ability to analyze data (comparing, explaining, interpreting, evaluating, making predictions, describing trends; drawing, formulating, or justifying conclusions).
Sixth Grade
-
Statistics and Probability
- Develop understanding of statistical variability.
- Summarize and describe distributions.
Statistics and Probability
-
Interpreting Categorical and Quantitative Data
- Summarize, represent, and interpret data on a single count or measurement variable
Grades 9-12
-
Data Analysis and Probability
- Develop and evaluate inferences and predictions that are based on data
- Formulate questions that can be addressed with data and collect, organize, and display relevant data to answer them
- Select and use appropriate statistical methods to analyze data
Advanced Functions and Modeling
-
Data Analysis and Probability
- Competency Goal 1: The learner will analyze data and apply probability concepts to solve problems.
AP Statistics
-
Geometry and Measurement
- Competency Goal 2: The learner will construct and interpret displays of univariate data to solve problems.
-
Number and Operations
- Competency Goal 1: The learner will analyze univariate data to solve problems.
Be Prepared to
- answer the question "What makes a distribution skewed?"
- discuss sample size and its effects on the result of an experiment