What is Fitted Normal Distribution?
This applet allows the user to experiment with randomly generated data sets at various sample sizes and standard deviations.
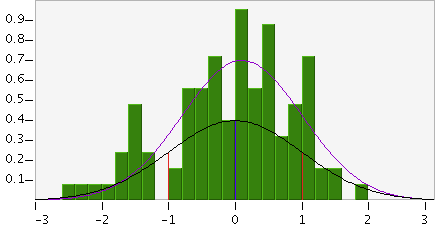
On the graph, the black curve and the Original Gaussian box show the expected mean, standard deviation, and amplitude values for the data set. When an experiment is done, the applet generates random numbers based on that distribution and then plots them on the same graph. Since these numbers are based on the original Gaussian, it is expected that the new distribution will be similar to the base distribution, but because the numbers are generated randomly, the new distribution will likely be slightly different.
In the real world, this variability is an inescapable quality of nature - scientists rarely have access to the "original Gaussian" and so must attempt to figure it out from their samples alone. To do this, they often take multiple trials at large sample sizes, to minimize the effect of randomness. In this applet, for instance, the fitted Gaussian will usually look more similar to the original Gaussian with a sample size of 10000 than with a sample size of 100.
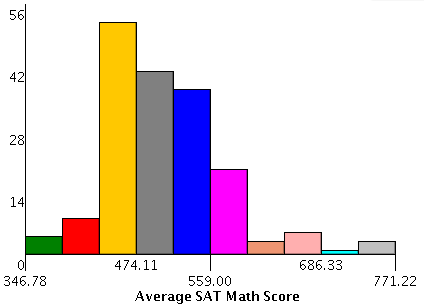
This distribution was generated using a sample size of 100. As you can see, there is a very
large degree of variability.
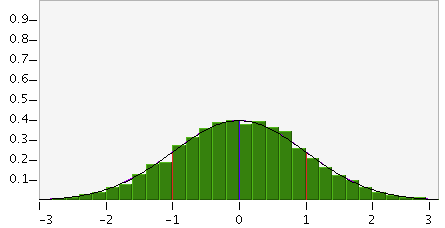
 This distribution, however, was generated using a sample size of 1000. In this case, there is
much less variability.
This distribution, however, was generated using a sample size of 1000. In this case, there is
much less variability.
Moreover, changing the standard deviation can also affect the variability of the sample. If your standard deviation is large, there will be more variability both in the individual numbers and in the fitted Gaussians as a whole. This means that scientists would require more experiments and larger sample sizes to accurately find the fitted Gaussian for highly variable real-world phenomena.
How Do I Use This Activity?
This activity allows the user to experiment with different bin sizes and numbers of trials with which to create a normal distribution.
Controls and Output
- The graph shows the values of the results of the normal distribution. The black curve on the graph shows the expected result of the trials, with a mean of zero represented by the blue line. The black circles at the bottom of the red lines show the standard deviation. The purple curve on the graph shows the fitted normal distribution of the trials, which is usually similar to the expected distribution.
- To change the standard deviation, click and drag any of the black circles. Dragging them closer together decreases the standard deviation, while dragging them apart increases the standard deviation. The maximum standard deviation is 1.250, while the minimum is 0.410.
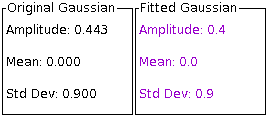
- In the boxes below the graph, information is displayed about the Original Gaussian and Fitted Gaussian. The amplitude of the distribution is the highest point on the graph. The mean is the average of all of the trial results. The standard deviation measures the variability of the trial results. Typically, all three of these measures will be relatively similar between the original and fitted Gaussians.
- You can also change the gridlines displayed on the graph in the Show box. These gridlines can help you to determine the exact height of each bar on the graph.
- To draw a histogram, choose the number of trials you want from the choices in the pull-down menu. You can change the bin size using the scrollbar. A new histogram will be generated automatically as you change the settings, but if you wish to generate another histogram without changing settings, you can press "Create new Histogram with".
Description
This activity allows the user to experiment with using random samples of various sizes to approximate standard deviations. Students can use this applet to understand how the variability of a sample changes based on both the number of trials and the standard deviation of the distribution. This activity would work best for groups of two to four students for about fifteen to twenty minutes.
Place in Mathematics Curriculum
This activity can be used to:
- reinforce the relationship between sample size and accuracy of a random sample
- reinforce the relationship between sample variability and accuracy of a random sample
- demonstrate the difference between theoretical (infinite-trial) and actual (small or large sample)
Standards Addressed
Grade 6
-
Statistics and Probability
- The student demonstrates an ability to classify and organize data.
- The student demonstrates an ability to analyze data (comparing, explaining, interpreting, evaluating; drawing or justifying conclusions).
Grade 7
-
Statistics and Probability
- The student demonstrates an ability to classify and organize data.
- The student demonstrates an ability to analyze data (comparing, explaining, interpreting, evaluating, making predictions; drawing or justifying conclusions).
Grade 8
-
Statistics and Probability
- The student demonstrates an ability to classify and organize data.
- The student demonstrates an ability to analyze data (comparing, explaining, interpreting, evaluating, making predictions, describing trends; drawing, formulating, or justifying conclusions).
Grade 9
-
Statistics and Probability
- The student demonstrates an ability to classify and organize data.
- The student demonstrates an ability to analyze data (comparing, explaining, interpreting, evaluating, making predictions, describing trends; drawing, formulating, or justifying conclusions).
Grade 10
-
Statistics and Probability
- The student demonstrates an ability to classify and organize data.
- The student demonstrates an ability to analyze data (comparing, explaining, interpreting, evaluating, making predictions, describing trends; drawing, formulating, or justifying conclusions).
Sixth Grade
-
Statistics and Probability
- Develop understanding of statistical variability.
- Summarize and describe distributions.
Statistics and Probability
-
Interpreting Categorical and Quantitative Data
- Summarize, represent, and interpret data on a single count or measurement variable
Grades 9-12
-
Data Analysis and Probability
- Develop and evaluate inferences and predictions that are based on data
- Formulate questions that can be addressed with data and collect, organize, and display relevant data to answer them
- Select and use appropriate statistical methods to analyze data
Advanced Functions and Modeling
-
Data Analysis and Probability
- Competency Goal 1: The learner will analyze data and apply probability concepts to solve problems.
AP Statistics
-
Geometry and Measurement
- Competency Goal 2: The learner will construct and interpret displays of univariate data to solve problems.
-
Number and Operations
- Competency Goal 1: The learner will analyze univariate data to solve problems.
Be Prepared to
- answer the question: "Why is the fitted Gaussian different from the original Gaussian?"
- discuss sample size and its effects on the result of an experiment
- discuss standard deviation and its effects on the result of an experiment