What is Stem and Leaf Plotter?
Stem-and-Leaf plots are used to analyze sets of data and are especially helpful when finding the following values:
- Mean: the sum of all the data points divided by the number of items, also known as the average.
- Median: the number in the middle when the data set is arranged in increasing order.
- Mode: the number that appears most frequently in the data. If there is more than one value that has the highest frequency then the data has more than one mode. If every number has the same frequency then there is no mode.
A Stem-and-Leaf plot is much like a histogram, displaying the number of times that an event within a particular range occurs. Yet, the stem-and-leaf plots reveals a little more information than a histogram, and it can show the exact data points. It is constructed by placing the first number of each data point on the left hand side of the line, and the remaining digits on the right-hand side on the line.
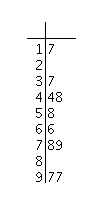
If we were to make a stem-and-leaf plot of a set of grades on the last test in my math class, it might look something like this:
This shows that there are 27 people in my class. One person failed the test, making a grade of 37, and three people made D's: 66, 68, and 69. There were 6 C's: 74, 74, 75, 76, 79, and 79; 10 B's: 82, 83, 83, 83, 85, 85, 86, 87, 87, 88; and 7 A's: 90, 91, 93, 97, 98, 99, and 100.
With this chart, calculating the mean, median, and mode will be much easier!
How Do I Use This Activity?
This activity displays a stem and leaf plot representing data either entered by the user or generated by the computer.
Controls and Output
To begin, the user should choose
View and
Guess mode.

In view mode, the user enters data that is placed into a stem and leaf plot.
-
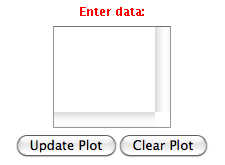
A box in the middle right of the applet allows the user to enter the data to be plotted.
Numbers should be placed on separate lines or should be separated by spaces or commas.
Only whole numbers between 0 and 999 (inclusive) should be entered.
-
Pressing the
Update Plot button will display the data as a stem and leaf plot in the large area at the left of the
applet. Pressing the
Clear Plot button will get rid of all data entered.
-
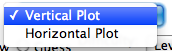
The user has the option to choose between a vertical plot or a horizontal plot using a
drop down menu.
In guess mode, the user attempts to calculate mean, median, and mode from a random data set.
-
Once
Guess has been selected, a random data set will appear along with the corresponding plot. The
user can then enter the calculations for the mean, median, and mode of the data in the
three areas provided in the lower right of the applet. If there is more than one mode,
separate the answers with spaces or commas.
-
Clicking on the
Check Answers button will tell the user if the answers are correct or incorrect. Answers must be
accurate to two decimal places to be considered correct. "Correct!" will be displayed in
each text box containing a correct answer. Otherwise, "Incorrect" will be displayed.
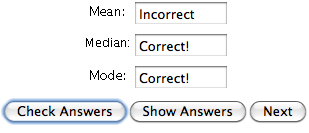
- Clicking on the Show Answers button will display the correct answers for each of the mean, median, and mode.
-
The difficulty can be changed using the difficulty drop down menu.
- When finished with the calculations, press the "Next" button to proceed to another problem.
Because this activity randomly generates questions, a feature called Seed Random has been implemented that allows multiple users using different computers to work on the same problem. See Seed Random Help for instructions on using this feature.
Description
This activity displays a stem and leaf plot representing data either entered by the user or generated by the computer. The user can use the applet as a tool that creates a stem and leaf plot from data the user inputs, or to practice calculating the mean, median, and mode of a given data set. This activity would work well in groups of two to four for about thirty minutes if you use the exploration questions and ten to fifteen minutes otherwise.
Place in Mathematics Curriculum
This activity can be used to:
- introduce the idea of a stem-and-leaf plot.
- introduce or reinforce the process of finding the mean, median, and mode of a set of data.
Standards Addressed
Grade 3
-
Statistics and Probability
- The student demonstrates an ability to classify and organize data.
- The student demonstrates an ability to analyze data (comparing, explaining, interpreting, or justifying conclusions).
Grade 4
-
Statistics and Probability
- The student demonstrates an ability to classify and organize data.
- The student demonstrates an ability to analyze data (comparing, explaining, interpreting, evaluating; drawing or justifying conclusions).
Grade 5
-
Statistics and Probability
- The student demonstrates an ability to classify and organize data.
- The student demonstrates an ability to analyze data (comparing, explaining, interpreting, evaluating; drawing or justifying conclusions).
Grade 6
-
Statistics and Probability
- The student demonstrates an ability to classify and organize data.
- The student demonstrates an ability to analyze data (comparing, explaining, interpreting, evaluating; drawing or justifying conclusions).
Grade 7
-
Statistics and Probability
- The student demonstrates an ability to classify and organize data.
- The student demonstrates an ability to analyze data (comparing, explaining, interpreting, evaluating, making predictions; drawing or justifying conclusions).
Grade 8
-
Statistics and Probability
- The student demonstrates an ability to classify and organize data.
- The student demonstrates an ability to analyze data (comparing, explaining, interpreting, evaluating, making predictions, describing trends; drawing, formulating, or justifying conclusions).
Grade 9
-
Statistics and Probability
- The student demonstrates an ability to classify and organize data.
- The student demonstrates an ability to analyze data (comparing, explaining, interpreting, evaluating, making predictions, describing trends; drawing, formulating, or justifying conclusions).
Grade 10
-
Statistics and Probability
- The student demonstrates an ability to classify and organize data.
- The student demonstrates an ability to analyze data (comparing, explaining, interpreting, evaluating, making predictions, describing trends; drawing, formulating, or justifying conclusions).
Statistics and Probability
-
Interpreting Categorical and Quantitative Data
- Summarize, represent, and interpret data on a single count or measurement variable
Grades 6-8
-
Data Analysis and Probability
- Formulate questions that can be addressed with data and collect, organize, and display relevant data to answer them
- Select and use appropriate statistical methods to analyze data
Grades 9-12
-
Data Analysis and Probability
- Formulate questions that can be addressed with data and collect, organize, and display relevant data to answer them
Grade 5
-
Number and Operations, Measurement, Geometry, Data Analysis and Probability, Algebra
- COMPETENCY GOAL 4: The learner will understand and use graphs and data analysis.
Grade 7
-
Number and Operations, Measurement, Geometry, Data Analysis and Probability, Algebra
- COMPETENCY GOAL 4: The learner will understand and use graphs and data analysis.
Grade 8
-
Number and Operations, Measurement, Geometry, Data Analysis and Probability, Algebra
- COMPETENCY GOAL 4: The learner will understand and use graphs and data analysis.
Introductory Mathematics
-
Algebra
- COMPETENCY GOAL 4: The learner will understand and use graphs and data analysis.
-
Data Analysis and Probability
- COMPETENCY GOAL 3: The learner will understand and use graphs and data analysis.
Advanced Functions and Modeling
-
Data Analysis and Probability
- Competency Goal 1: The learner will analyze data and apply probability concepts to solve problems.
Integrated Mathematics
-
Data Analysis and Probability
- Competency Goal 3: The learner will analyze data and apply probability concepts to solve problems.
AP Statistics
-
Number and Operations
- Competency Goal 1: The learner will analyze univariate data to solve problems.
6th Grade
-
Data Analysis and Probability
- The student will demonstrate through the mathematical processes an understanding of the relationships within one population or sample.
5th Grade
-
Data Analysis and Probability
- The student will demonstrate through the mathematical processes an understanding of investigation design, the effect of data-collection methods on a data set, the interpretation and application of the measures of central tendency, and the application of basic concepts of probability.
4th Grade
-
Data Analysis and Probability
- Standard 4-6: The student will demonstrate through the mathematical processes an understanding of the impact of data-collection methods, the appropriate graph for categorical or numerical data, and the analysis of possible outcomes for a simple event.
8th Grade
-
Data Analysis and Probability
- The student will demonstrate through the mathematical processes an understanding of the relationships between two variables within one population or sample.
5th Grade
-
Data Analysis & Probability
- The student will understand and apply basic statistical and probability concepts in order to organize and analyze data and to make predictions and conjectures.
6th Grade
-
Data Analysis & Probability
- Content Standard 5.0 The student will understand and apply basic statistical and probability concepts in order to organize and analyze data and to make predictions and conjectures.
7th Grade
-
Data Analysis & Probability
- The student will understand and apply basic statistical and probability concepts in order to organize and analyze data and to make predictions and conjectures.
8th Grade
-
Data Analysis & Probability
- The student will understand and apply basic statistical and probability concepts in order to organize and analyze data and to make predictions and conjectures.
Grade 7
-
Probability and Statistics
- 12. The student uses measures of central tendency and variability to describe a set of data.
Grade 8
-
Probability and Statistics
- 12. The student uses statistical procedures to describe data.
7th Grade
-
Probability and Statistics
- 7.16 The student will create and solve problems involving the measures of central tendency (mean, median, mode) and the range of a set of data.
- 7.17 The student, given a problem situation, will collect, analyze, display, and interpret data, using a variety of graphical methods, including frequency distributions; line plots; histograms; stem-and-leaf plots; box-and-whisker plots; and scattergrams.
5th Grade
-
Probability and Statistics
- 5.17c The student will create a problem statement involving probability and based on information from a given problem situation. Students will not be required to solve the created problem statement.
- 5.18 The student will, given a problem situation, collect, organize, and display a set of numerical data in a variety of forms, using bar graphs, stem-and-leaf plots, and line graphs, to draw conclusions and make predictions.
- 5.19 The student will find the mean, median, mode, and range of a set of data.
6th Grade
-
Probability and Statistics
- 6.18b The student, given a problem situation, will collect, analyze, display, and interpret data in a variety of graphical methods, including stem-and-leaf plots
- 6.19 The student will describe the mean, median, and mode as measures of central tendency, describe the range, and determine their meaning for a set of data.
Secondary
-
Algebra II
- AII.09 The student will find the domain, range, zeros, and inverse of a function; the value of a function for a given element in its domain; and the composition of multiple functions. Functions will include exponential, logarithmic, and those that have domains and ranges that are limited and/or discontinuous. The graphing calculator will be used as a tool to assist in investigation of functions.
- AII.9
Textbooks Aligned
Grade Six
-
Data About Us
- Investigation Three: Using Graphs to Group Data
- Investigation Five: What Do We Mean by Mean?
6th
-
Module 4 - Statistical Safari
- Section 4: Stem-and-Leaf Plots, Decimal Division, and Graphing
7th
-
Module 5 - Recreation
- Section 1: Ratios and Data Displays
8th
-
Module 1 - Amazing Feats and Facts and Fiction
- Section 2: Displaying Data
Book 3
-
Looking Behind the Numbers
- Lesson 3: Mystery Data
- Lesson 4: Top Teams
Grade 8
-
Insights into Data
- Gathering Data
- Representation of Data
Grade 5
-
Picturing Numbers
- Pictographs
- Describing Data
- Using Data for Arguments
-
Taking A Chance
- Tree Diagrams
Grade 6
-
Dealing With Data
- Stem and Leaf Plot
-
Tracking Graphs
- Looking at a Graph's global features
Grade 7
-
Decision Making
- Graphs of Data
-
Statistics and the Environment
- Collecting Data
- Graphs and Tables
Be Prepared to
- discuss stem-and-leaf plots, how to construct one, and how to interpret one.
- give implicit directions on what they are to do. For example "Today we are going to practice making and interpreting stem-and-leaf plots."
- answer the question "What is a mean/median/mode?"