What is Bar Graph Sorter?
This activity allows the user to explore sorting shapes by color or by shape in order to create a bar graph. It is appropriate for younger students.
Bar graphs are a type of graph that compares amounts of something by category. In the case of the Bar Graph Sorter, the user creates a bar graph by sorting shapes by color or shape into the different categories. Thus the user learns about bar graphs as well as classification.
How Do I Use This Activity?
This activity allows the user to sort shapes into a bar graph by shape or color. There are two modes. The Random Set mode gives you a set of 6-15 random shapes to sort into a bar graph, or the Make Your Own mode which allows you to build your own bar graph by sorting shapes into the graph.
Controls and Output
-
There are two modes of functioning in this activity,
Make Your Own or Random Set. To switch between modes, click this button:

-
In both modes, you can chose to sort either by shape or color. To sort by shape, make sure
the shape button is pressed:
-
To sort by color, make sure the color button is pressed:
-
In both modes you can chose to create your graph horizontally or vertically. To create a
horizontal graph, make sure the horizontal button is pressed.
-
To create a vertical graph, make sure the vertical button is pressed:
- When in the Random Set mode, you can get a new set of shapes to sort by clicking the New Set button. To reset the current problem, click the Reset button.
- When in the Make Your Own mode, you can reset the board by clicking the reset button.
-
In both modes to sort the shapes, click on a shape from above the bar graph and drag and
drop it in the appropriate bar. The size of the bar, the tally, and the count will
increase if the shape has been sorted properly:
The results of your actions are cataloged on the scoreboard, if you so desire. To view the scoreboard, click this button:

This will create a pop-up window that displays your number of correct shape assignments. The top half of the scorecard displays the results of your actions thus far on the current set only, while the bottom half of the scorecard displays your cumulative scores. Scores are divided into four categories: sorting by shape into horizontal grpahs, sorting by shape into vertical graphs, sorting by color into horizontal graphs, and sorting by color into vertical graphs. If, at any time, you wish to clear all current scores, you may do so by pressing the reset button.
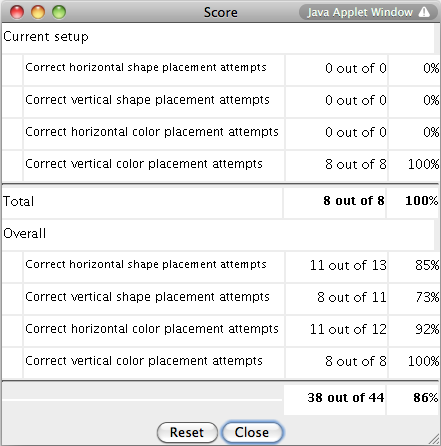
To change whether or not your actions are being scored, click to toggle between these two buttons. While the mode is set to Paused, no score will be tallied, but your previous scores will remain in the scorecard unless separately cleared.


Description
This activity allows the user to explore simple bargraphs through sorting shapes by color or shape into the graph. This activity would work well in conjunction with the Bar graph and/or Venn Diagram Shape Sorter activity.
Place in Mathematics Curriculum
This activity can be used to:
- Introduce bargraphs.
- Help students learn to sort by a particular attribute.
Standards Addressed
Grade 3
-
Statistics and Probability
- The student demonstrates an ability to classify and organize data.
- The student demonstrates an ability to analyze data (comparing, explaining, interpreting, or justifying conclusions).
Grade 4
-
Statistics and Probability
- The student demonstrates an ability to classify and organize data.
- The student demonstrates an ability to analyze data (comparing, explaining, interpreting, evaluating; drawing or justifying conclusions).
Grade 5
-
Statistics and Probability
- The student demonstrates an ability to classify and organize data.
- The student demonstrates an ability to analyze data (comparing, explaining, interpreting, evaluating; drawing or justifying conclusions).
Grade 6
-
Statistics and Probability
- The student demonstrates an ability to classify and organize data.
- The student demonstrates an ability to analyze data (comparing, explaining, interpreting, evaluating; drawing or justifying conclusions).
Grade 7
-
Statistics and Probability
- The student demonstrates an ability to classify and organize data.
- The student demonstrates an ability to analyze data (comparing, explaining, interpreting, evaluating, making predictions; drawing or justifying conclusions).
Grade 8
-
Statistics and Probability
- The student demonstrates an ability to classify and organize data.
- The student demonstrates an ability to analyze data (comparing, explaining, interpreting, evaluating, making predictions, describing trends; drawing, formulating, or justifying conclusions).
Grade 9
-
Statistics and Probability
- The student demonstrates an ability to classify and organize data.
- The student demonstrates an ability to analyze data (comparing, explaining, interpreting, evaluating, making predictions, describing trends; drawing, formulating, or justifying conclusions).
Grade 10
-
Statistics and Probability
- The student demonstrates an ability to classify and organize data.
- The student demonstrates an ability to analyze data (comparing, explaining, interpreting, evaluating, making predictions, describing trends; drawing, formulating, or justifying conclusions).
Grade 3
-
Measurement and Geometry
- 2.0 Students describe and compare the attributes of plane and solid geometric figures and use their understanding to show relationships and solve problems
Grade 4
-
Measurement and Geometry
- 3.0 Students demonstrate an understanding of plane and solid geometric objects and use this knowledge to show relationships and solve problems
Grade 5
-
Measurement and Geometry
- 2.0 Students identify, describe, and classify the properties of, and the relationships between, plane and solid geometric figures
Third Grade
-
Geometry
- Reason with shapes and their attributes.
-
Measurement and Data
- Represent and interpret data.
Fourth Grade
-
Measurement and Data
- Represent and interpret data.
Fifth Grade
-
Geometry
- Classify two-dimensional figures into categories based on their properties.
-
Measurement and Data
- Represent and interpret data.
Statistics and Probability
-
Interpreting Categorical and Quantitative Data
- Summarize, represent, and interpret data on a single count or measurement variable
Grades 3-5
-
Data Analysis and Probability
- Formulate questions that can be addressed with data and collect, organize, and display relevant data to answer them
Grade 3
-
Number and Operations, Measurement, Geometry, Data Analysis and Probability, Algebra
- COMPETENCY GOAL 4: The learner will understand and use data and simple probability concepts.
5th Grade
-
Data Analysis & Probability
- The student will understand and apply basic statistical and probability concepts in order to organize and analyze data and to make predictions and conjectures.
3rd Grade
-
Data Analysis
- Content Standard 5.0 The student will understand and apply basic statistical and probability concepts in order to organize and analyze data and to make predictions and conjectures.
4th Grade
-
Data Analysis & Probability
- The student will understand and apply basic statistical and probability concepts in order to organize and analyze data and to make predictions and conjectures.
Textbooks Aligned
Grade Six
-
Data About Us
- Investigation One: Looking at Data
- Investigation Two: Types of Data
Grade Seven
-
Data Around Us
- Investigation Three: Comparing Large Numbers
-
What Do You Expect?
- Investigation Three: Probability and Area
Grade Eight
-
Samples and Populations
- Investigation One: Comparing Data Sets
Book 1
-
Module 3 - Statistical Safari
- Section 3: Bar Graphs
- Section 3: Line Plots
Book 2
-
Module 1 - Making Choices
- Section 1: Bar Graphs, Line Graphs
Book 3
-
Module 8 - Making an Impact
- Section 2: Circle Graphs
- Section 2: Histograms
- Section 3: Misleading Graphs
Book 1
-
What Does the Data Say?
- Lesson 4: Animal Comparisons
- Lesson 5: Double Data
- Lesson 6: Across the Ages
Book 2
-
From the Ground Up
- Lesson 10: Adding the Cost of Labor
Grade 8
-
Insights into Data
- Understanding Graphs
- Gathering Data
- Bias
- Representation of Data
- Correlations
- Scatter Plots
- Box Plots
Grade 5
-
Picturing Numbers
- Bar Graphs
- Line Graphs
- Pie Charts
- Pictographs
- Describing Data
- Using Data for Arguments
Grade 6
-
Dealing With Data
- Scatter Plots
- Box Plots
- Stem and Leaf Plot
- Histograms
- Mean, Median, Mode and Range
Grade 7
-
Decision Making
- Graphs of Data
- Constraints
- Graphing Inequalities
- Discrete Functions
Be Prepared to
- give directions on what they are to do. For example, let them know what settings you would likethem to use and what the differences between the settings are.
- explain tallies.
- discuss examples or other data that could be used in a bar graph and what types of data that couldnot be used in a bar graph.