What is Triple Venn Diagram Shape Sorter?
Venn Diagrams were first developed by John Venn in the 1880's. They are useful for illustrating
the relationships between sets. Each set is illustrated by a circle. When two circles overlap,
this shows an intersection of the two sets. For more practice with one or two set Venn Diagrams,
students may use the
Venn Diagram Shape Sorter. When working with three sets, three circles are needed to illustrate all possible
relationships among the sets. John Venn and other mathematicians have presented complicated
diagrams for sets greater than three. Diagrams with one, two, or three circles are the most
common. If we want to consider how the sets of positive integers, even integers, and multiples
of 3 are related to one another, we could draw the following picture:
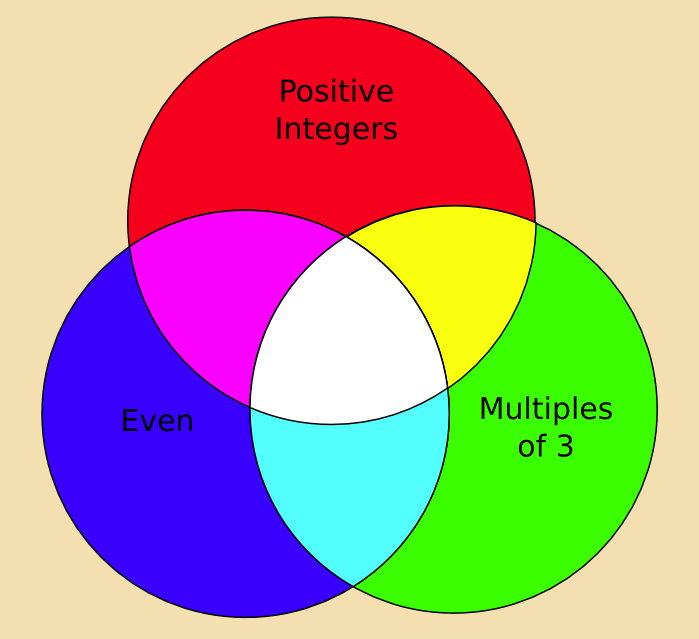
The positions of the three circles tell us information about what each set includes. The set labeled Even is partially inside of the set of Positive Integers because Positive Integers includes some Even, such as 8 or 26; however, Positive Integers also includes many numbers that are not even, such as 13 or 9,174,823, so part of the set Positive Integers is outside the set of Even. Likewise, Even includes many numbers that are not Positive Integers, such as -4 and -192, so part of the set Even is outside of the set Positive Integers.
The set labeled Multiples of 3 also intersects with the set Positive Integers because Positive Integers includes many Multiples of 3, such as 9 or 27; however, Positive Integers also includes many numbers that are not Multiples of 3, such as 1 or 17, so part of the set of Positive Integers is outside of the set Multiples of 3. Likewise, there are numbers which are Multiples of 3 that are not contained within the set Positive Integers, such as -6 or -87,630, so part of the set Multiples of 3 is outside of the set Positive Integers.
The sets labeled Even and Multiples of 3 intersect because some Even are Multiples of 3, and vice versa. A number like -6 would go in the intersection between Even and Multiples of 3 because it is both even and divisible by 3.
All three areas intersect in the center of the diagram. This area holds all numbers that are (a) Even, (b) Divisible by 3, and (c) Positive, such as 6 or 12.
Finally, outside of all the circles lies everything else. This space technically includes the universe and everything in it, from numbers not contained in any category (-5, -19) to imaginary numbers (3 i ) and even non-numerical sets of data (letters, song titles, etc). Anything that is not an integer that is positive, even, and/or divisible by 3 is considered to lie outside of the Venn Diagram.
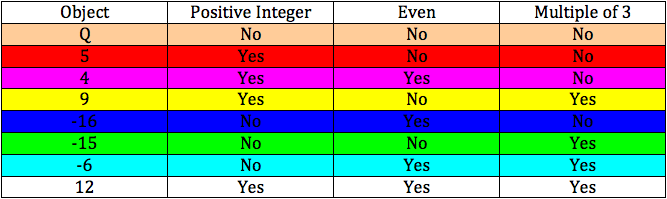
The following table gives examples of numbers that would go in each of the categories. The color of the number corresponds to that category's color in the Venn Diagram.
Controls and Output
There are two ways to play this activity. You can choose to
Make the rules or
Guess the rules.
Description
This activity allows the user to explore Venn Diagrams with three circles. Students can sort shapes into known categories or can guess what the categories are by experimenting with sorting. This activity would work well in groups of two for twenty to thirty minutes if you use the exploration questions and ten to fifteen otherwise.
Place in Mathematics Curriculum
This activity can be used to:
- introduce the concept of Venn Diagrams
- explore different types of diagrams
- develop logical thinking
- use Venn Diagrams as a tool for describing relationships in various academic subjects
Standards Addressed
Grade 3
-
Geometry
- The student demonstrates a conceptual understanding of geometric drawings or constructions.
-
Process Skills
- The student demonstrates an ability to problem solve.
- The student communicates his or her mathematical thinking.
- The student demonstrates an ability to use logic and reason.
-
Statistics and Probability
- The student demonstrates an ability to classify and organize data.
- The student demonstrates an ability to analyze data (comparing, explaining, interpreting, or justifying conclusions).
Grade 4
-
Geometry
- The student demonstrates a conceptual understanding of geometric drawings or constructions.
-
Process Skills
- The student demonstrates an ability to problem solve.
- The student communicates his or her mathematical thinking.
- The student demonstrates an ability to use logic and reason.
-
Statistics and Probability
- The student demonstrates an ability to classify and organize data.
- The student demonstrates an ability to analyze data (comparing, explaining, interpreting, evaluating; drawing or justifying conclusions).
Grade 5
-
Functions and Relationships
- The student communicates his or her mathematical thinking.
- The student demonstrates an ability to use logic and reason.
-
Geometry
- The student demonstrates a conceptual understanding of geometric drawings or constructions.
-
Process Skills
- The student demonstrates an ability to problem solve.
- The student communicates his or her mathematical thinking.
- The student demonstrates an ability to use logic and reason.
-
Statistics and Probability
- The student demonstrates an ability to classify and organize data.
- The student demonstrates an ability to analyze data (comparing, explaining, interpreting, evaluating; drawing or justifying conclusions).
Grade 6
-
Process Skills
- The student demonstrates an ability to problem solve.
- The student communicates his or her mathematical thinking.
- The student demonstrates an ability to use logic and reason.
-
Statistics and Probability
- The student demonstrates an ability to classify and organize data.
Grade 7
-
Process Skills
- The student demonstrates an ability to problem solve.
- The student communicates his or her mathematical thinking.
- The student demonstrates an ability to use logic and reason.
-
Statistics and Probability
- The student demonstrates an ability to classify and organize data.
Grade 8
-
Process Skills
- The student demonstrates an ability to problem solve.
- The student communicates his or her mathematical thinking.
- The student demonstrates an ability to use logic and reason.
-
Statistics and Probability
- The student demonstrates an ability to classify and organize data.
Grade 9
-
Process Skills
- The student demonstrates an ability to problem solve.
- The student communicates his or her mathematical thinking.
- The student demonstrates an ability to use logic and reason.
Grade 10
-
Process Skills
- The student demonstrates an ability to problem solve.
- The student communicates his or her mathematical thinking.
- The student demonstrates an ability to use logic and reason.
Grade 3
-
Measurement and Geometry
- 2.0 Students describe and compare the attributes of plane and solid geometric figures and use their understanding to show relationships and solve problems
Grade 4
-
Measurement and Geometry
- 3.0 Students demonstrate an understanding of plane and solid geometric objects and use this knowledge to show relationships and solve problems
Grade 5
-
Measurement and Geometry
- 2.0 Students identify, describe, and classify the properties of, and the relationships between, plane and solid geometric figures
Third Grade
-
Geometry
- Reason with shapes and their attributes.
Fifth Grade
-
Geometry
- Classify two-dimensional figures into categories based on their properties.
Grades 3-5
-
Algebra
- Understand patterns, relations, and functions
Grades 6-8
-
Geometry
- Use visualization, spatial reasoning, and geometric modeling to solve problems
Technical Mathematics I
-
Number and Operations
- Competency Goal 1: The learner will apply various strategies to solve problems.
5th Grade
-
Algebra
- The student will understand and generalize patterns as they represent and analyze quantitative relationships and change in a variety of contexts and problems using graphs, tables, and equations.
3rd Grade
-
Algebra
- Content Standard 2.0 The student will understand and generalize patterns as they represent and analyze quantitative relationships and change in a variety of contexts and problems using graphs, tables, and equations.
4th Grade
-
Algebra
- The student will understand and generalize patterns as they represent and analyze quantitative relationships and change in a variety of contexts and problems using graphs, tables, and equations.
Grade 3
-
Underlying Processes and Mathematical Tools
- 16. The student uses logical reasoning.
Grade 4
-
Underlying Processes and Mathematical Tools
- 16. The student uses logical reasoning.
Grade 5
-
Underlying Processes and Mathematical Tools
- 16. The student uses logical reasoning.
Textbooks Aligned
Grade Six
-
Prime Time
- Investigation Six: The Locker Problem
6th
-
Module 2 - Math Detectives
- Section 4: Polygons and Angles
Book 2
-
Getting In Shape
- Lesson 5: Polygon Power!
Grade 5
-
Picturing Numbers
- Using Data for Arguments
Grade 6
-
Comparing Quantities
- Patterns
Be Prepared to
- explain why some objects don't fall under the categories of any of the circles
- help students figure out how to guess the rule without placing every shape in the diagram