What is Venn Diagram Shape Sorter?
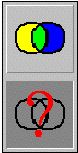
The Shape Sorter activity involves using Venn Diagrams. Venn Diagrams were first developed by John Venn in the 1880s. They are useful for illustrating the relationships between sets. For example if we want to represent the set of all counting numbers, and illustrate how even numbers and multiples of 3 are related, we could draw the following picture:
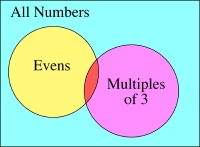
See how the circles overlap but not completely -- why? Because 6 is both even and a multiple of 3, but there are many numbers that are even and not multiples of 3 and vice versa. Numbers which are in both sets would be located in the little red sliver where the circles overlap.
How Do I Use This Activity?
Object of the activity
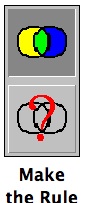
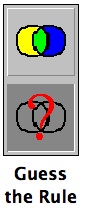
There are two ways to play this activity. At the left side of the screen you can choose to play either the version in which you guess the rule, or the version in which you make the rule.
|
|
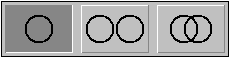
Both versions allow you to use a single circle, two non-overlapping circles, or two overlapping circles. To switch between these 3 versions, you need to click on the appropriate tabs:
Controls and Output
Guessing the Rule
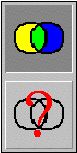
In this mode, the program creates a rule for you and you must guess the rule. To get into this mode, you need to press on the circles with the question mark over them:
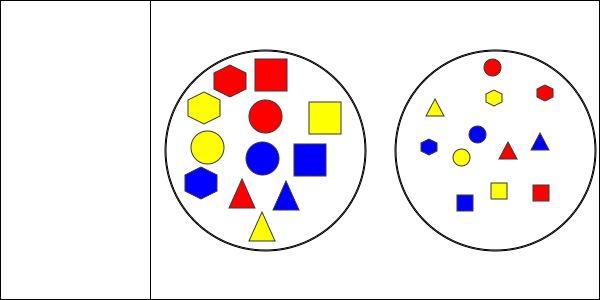
- Begin by attempting to click and drag different colored shapes into the circle(s). Try to guess the rule for the circle(s) based on which shapes and colors the circle(s) accepts or rejects.
-
When you believe you know the rule for the circle(s), make your guess in the appropriate
menu and then click on the
 button.
-
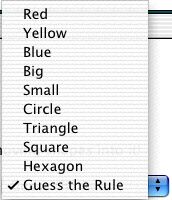
If you have only one circle, you will see something that looks like this:

You can scroll down and choose your guess for the rule of the circle. You can choose between several shapes, colors, and sizes:
-
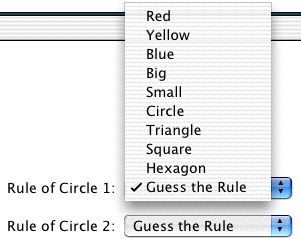
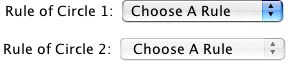
If you have two circles, either overlapping or non-overlapping, you will see something that looks like this:
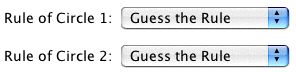
You can guess what the first circle is by scrolling down the list:
The second circle is done just as the first.
-
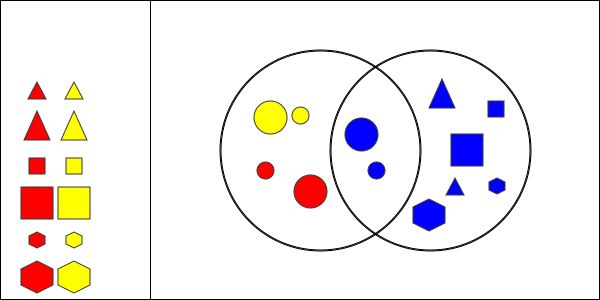
Here is an example of the first circle having large shapes and the second circle having
small shapes:
-
Before you click on the
button, there is a display that says:

-
If you guess the wrong rule, you will see a display that looks like:

-
If you have the correct guess, you will see:

-
If you want to guess a new rule, you click on the
 button.
-
If you want to put all of the shapes in the diagram back into the original list of shapes,
you press on the
 button. This does not give you a new rule to guess.
In this mode, you set the rule for the circle(s) and then you must place the shapes in the appropriate place. To get into this mode, you need to press on the 2 circles without the question mark:
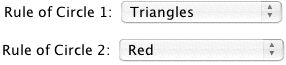
- Use the pull down menus to set the rule for each circle.
-
If there is just one circle, you will see this:

-
You can choose between any of the shape, color, and size rules. In this example, all of the shapes in circle 1 will be red:

Once you have chosen some rule for circle 1, it will automatically go into effect, as you see the option for scrolling disappear. There is no need to press on any other button.
-
If there are two circles, you will see:
-
You can choose any of the characteristics for the first circle. In the example, the rule
for circle 1 is that all of the shapes must be triangles.
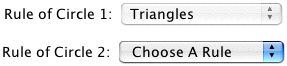
-
For the second circle, only some of the characteristics are available. For example, when
you have 2 non-overlapping circles, if one circle has big shapes, the only possible
characteristic for the other circle would be small shapes. In the example below, the
second circle overlaps with the first, and it contains red shapes:
-
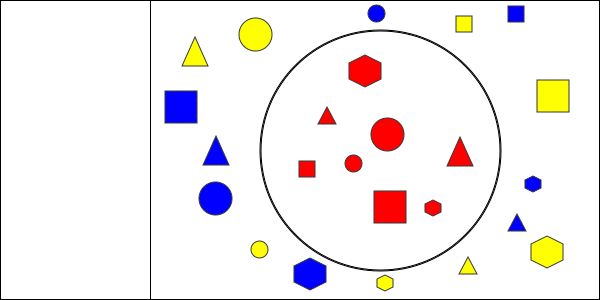
Next, you must drag each of the shapes to their appropriate place in the Venn Diagram. The Venn Diagram for just one circle with red shapes inside it is:
The Venn diagram for the 2 non-overlapping circles with the first circle containing big shapes and the second circle containing small shapes is:
The Venn diagram for 2 overlapping circles with the first circle containing the circle shapes, the second circle containing blue shapes and the middle section containing blue circles:
Scoring:
-
This activity will automatically record how successful you are at placing shapes in the venn diagram and guessing the rules of the venn diagram. To view the score, press the Show Score button at the bottom of the activity and a pop-up window will appear with the scoreboard.
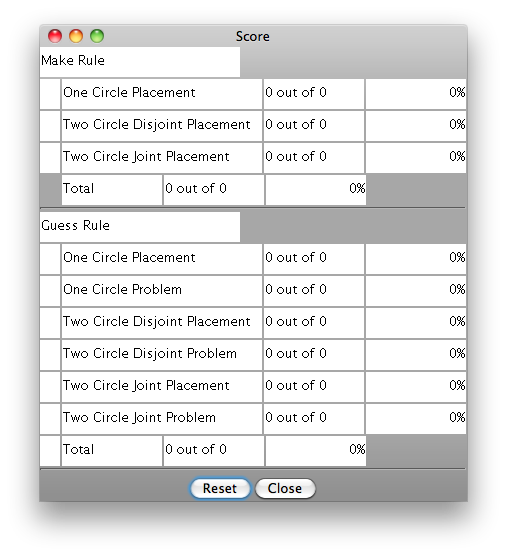
To close this pop-up window press the Close button or click back on the main window.
- To pause the scoring, press the Active button at the bottom of the screen and it will change to a Paused button. To resume scoring, press the Paused button.
- To reset the scoreboard, open the scoreboard using the Show Score button and then press the Reset button.
Description
This activity allows the user to explore Venn Diagrams and their various applications. This activity would work well in groups of two for about thirty to forty-five minutes if you use the exploration questions and fifteen to twenty minutes otherwise.
Place in Mathematics Curriculum
This activity can be used to:
- introduce the concept of Venn Diagrams.
- explore different types of Diagrams.
- apply Venn Diagrams as a tool for exploring various academic subjects
Standards Addressed
Grade 3
-
Geometry
- The student demonstrates a conceptual understanding of geometric drawings or constructions.
-
Process Skills
- The student demonstrates an ability to problem solve.
- The student communicates his or her mathematical thinking.
- The student demonstrates an ability to use logic and reason.
-
Statistics and Probability
- The student demonstrates an ability to classify and organize data.
- The student demonstrates an ability to analyze data (comparing, explaining, interpreting, or justifying conclusions).
Grade 4
-
Geometry
- The student demonstrates a conceptual understanding of geometric drawings or constructions.
-
Process Skills
- The student demonstrates an ability to problem solve.
- The student communicates his or her mathematical thinking.
- The student demonstrates an ability to use logic and reason.
-
Statistics and Probability
- The student demonstrates an ability to classify and organize data.
- The student demonstrates an ability to analyze data (comparing, explaining, interpreting, evaluating; drawing or justifying conclusions).
Grade 5
-
Functions and Relationships
- The student communicates his or her mathematical thinking.
- The student demonstrates an ability to use logic and reason.
-
Geometry
- The student demonstrates a conceptual understanding of geometric drawings or constructions.
-
Process Skills
- The student demonstrates an ability to problem solve.
- The student communicates his or her mathematical thinking.
- The student demonstrates an ability to use logic and reason.
-
Statistics and Probability
- The student demonstrates an ability to classify and organize data.
- The student demonstrates an ability to analyze data (comparing, explaining, interpreting, evaluating; drawing or justifying conclusions).
Grade 6
-
Process Skills
- The student demonstrates an ability to problem solve.
- The student communicates his or her mathematical thinking.
- The student demonstrates an ability to use logic and reason.
-
Statistics and Probability
- The student demonstrates an ability to classify and organize data.
Grade 7
-
Process Skills
- The student demonstrates an ability to problem solve.
- The student communicates his or her mathematical thinking.
- The student demonstrates an ability to use logic and reason.
-
Statistics and Probability
- The student demonstrates an ability to classify and organize data.
Grade 8
-
Process Skills
- The student demonstrates an ability to problem solve.
- The student communicates his or her mathematical thinking.
- The student demonstrates an ability to use logic and reason.
-
Statistics and Probability
- The student demonstrates an ability to classify and organize data.
Grade 9
-
Process Skills
- The student demonstrates an ability to problem solve.
- The student communicates his or her mathematical thinking.
- The student demonstrates an ability to use logic and reason.
Grade 10
-
Process Skills
- The student demonstrates an ability to problem solve.
- The student communicates his or her mathematical thinking.
- The student demonstrates an ability to use logic and reason.
Grade 3
-
Measurement and Geometry
- 2.0 Students describe and compare the attributes of plane and solid geometric figures and use their understanding to show relationships and solve problems
Grade 4
-
Measurement and Geometry
- 3.0 Students demonstrate an understanding of plane and solid geometric objects and use this knowledge to show relationships and solve problems
Grade 5
-
Measurement and Geometry
- 2.0 Students identify, describe, and classify the properties of, and the relationships between, plane and solid geometric figures
Third Grade
-
Geometry
- Reason with shapes and their attributes.
Fifth Grade
-
Geometry
- Classify two-dimensional figures into categories based on their properties.
Grades 3-5
-
Algebra
- Understand patterns, relations, and functions
- Use mathematical models to represent and understand quantitative relationships
Grades 6-8
-
Data Analysis and Probability
- Understand and apply basic concepts of probability
-
Geometry
- Use visualization, spatial reasoning, and geometric modeling to solve problems
Technical Mathematics I
-
Number and Operations
- Competency Goal 1: The learner will apply various strategies to solve problems.
5th Grade
-
Algebra
- The student will understand and generalize patterns as they represent and analyze quantitative relationships and change in a variety of contexts and problems using graphs, tables, and equations.
3rd Grade
-
Algebra
- Content Standard 2.0 The student will understand and generalize patterns as they represent and analyze quantitative relationships and change in a variety of contexts and problems using graphs, tables, and equations.
4th Grade
-
Algebra
- The student will understand and generalize patterns as they represent and analyze quantitative relationships and change in a variety of contexts and problems using graphs, tables, and equations.
Grade 3
-
Underlying Processes and Mathematical Tools
- 16. The student uses logical reasoning.
Grade 4
-
Underlying Processes and Mathematical Tools
- 16. The student uses logical reasoning.
Grade 5
-
Underlying Processes and Mathematical Tools
- 16. The student uses logical reasoning.
Textbooks Aligned
Grade Six
-
Prime Time
- Investigation One: The Factor Game
- Investigation Two: The Product Game
- Investigation Three: Factor Pairs
- Investigation Four: Common Factors and Multiples
- Investigation Five: Factorizations
- Investigation Six: The Locker Problem
6th
-
Module 2 - Math Detectives
- Section 4: Polygons and Angles
Book 2
-
Getting In Shape
- Lesson 5: Polygon Power!
Grade 5
-
Picturing Numbers
- Pictographs
- Describing Data
- Using Data for Arguments
Grade 6
-
Comparing Quantities
- Word Problems
- Patterns
Be Prepared to
- explain all vocabulary words used in the applet.
- explain what happens when the object being classified does not fall under the categories of any of the circles
- give the categories for the class Venn diagram for question three in the exploration questions.