What is Regression?
Correlation and regression are used regularly in statistical analysis. Correlation is used to see if a relationship exists between two variables and can be used to answer questions like these: Do you think there is any relationship between:
- the amount of time you spend studying for a test and the grade you make?
- the amount of time a team spends practicing and the number of wins they have in a season?
- how tall you are and your weight?
- the type f shoes you wear and how fast you can run?
If a relationship is found then correlation can be used to determine how strong the relationship is. Once a correlation has been discovered, regression is used to find the equation used to relate the two variables. This equation can tell you if the two variables are positively or negatively related.
How Do I Use This Activity?
The regression applet is designed to allow the user to plot a bivariate data set, determine the line of best fit for their data, and then check the accuracy of their line of best fit.
Controls and Output
-
First, the user needs to input their data. This can be done one of two ways.
-
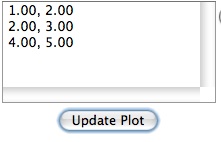
The user can type the coordinates in the data box and click the
Update Plot button.
 If you have trouble copying data from the applet and pasting it into an Excel
spreadsheet, please see our
Excel Copy/Paste Help.
If you have trouble copying data from the applet and pasting it into an Excel
spreadsheet, please see our
Excel Copy/Paste Help.
-
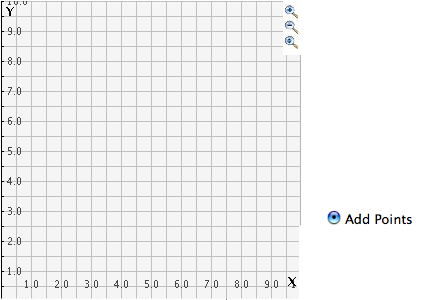
The user can plot points on the grid by selecting the
Add Points button then placing the mouse over the desired location on the grid, clicking, and
repeating this process for each data point.
-
The user can type the coordinates in the data box and click the
Update Plot button.
-
When the user has finished entering the data, they can try to create a line of best fit by
checking the
Fit your own line box.
-
A green line will appear on the grid once the
Fit your own line box has been checked. The user can move this by checking the
Move Fit Line button then clicking on the green circles and dragging them to the desired location.
-
The user can check the accuracy of their line of best fit by checking the
Display line of best fit box.
- r is the linear correlation coefficient. r describes the strength of the linear relationship. r is a number between -1 and 1. If r = 0 there is no correlation between the data. If the r is positive, the data have a positive correlation. If the r is negative, the data have a negative correlation. The closer the r is to 1, the stronger the positive correlation. The closer the r is to -1, the stronger the negative correlation.
- Y denotes the line equation.
-
The user can remove points by either deleting them from the data box and clicking the
Update Plot button or by checking the
Remove Points box and then clicking on the unwanted points on the grid.
-
The user can move points by checking the
Move Points box, then clicking on, and dragging the point they wish to move to the desired new
location.
-
Zoom/Pan buttons. In the upper right corner of the graph, there are three buttons with pictures of
magnifying glasses. From top to bottom these buttons represent zoom in, zoom out, and pan,
respectively.
-
To zoom in, click the top button to depress, then click and drag over the area of the
graph for which you wish to zoom to. The images below show the preimage as the user
drags over the area in which to zoom and the resulting zoomed image. Note that after
clicking and dragging over the selected area, the zoom in button is automatically
released.
- To zoom out, simply click the middle button. The graph will automatically zoom out by doubling the min and max values of the axes.
- To use the pan feature, click the bottom magnifying glass button to depress it. Click and drag over the graph and the graph will pan around according to the movement of the mouse. Upon releasing the mouse, the pan button is released.
-
The user can show the residuals by clicking the
Show Residuals button.
-
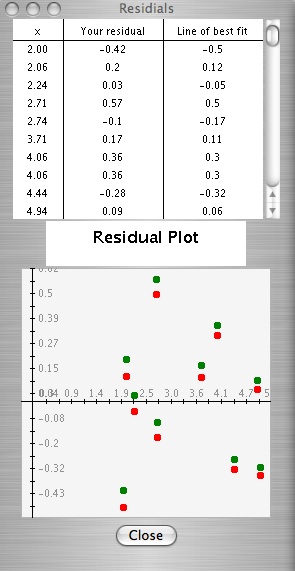
Once the user clicks the
Show Residuals button a residuals screen appears. In the first column of the table located at the
top of the residuals screen are the x-coordinates of each data point. In the second
column are the residuals from your line. And in the third column are the residuals
from the line of best fit. Located at the bottom of the residuals screen is a
Residuals Plot. If the
Display line of best fit box is checked, red dots will appear on the graph. If the
Fit your own line box is checked, green dots will appear on the graph. If both the
Display line of best fit and
Fit your own line are checked, both red and green dots will appear on the graph. This graph depicts the
distance between the lines of best fit and the actual data points.
-
The user can reset the graph to its original state by clicking the reset button
located at the bottom right side of the screen.

-
To zoom in, click the top button to depress, then click and drag over the area of the
graph for which you wish to zoom to. The images below show the preimage as the user
drags over the area in which to zoom and the resulting zoomed image. Note that after
clicking and dragging over the selected area, the zoom in button is automatically
released.
Description
The regression applet is designed to allow the user to plot a bivariate data set, determine the line of best fit for their data, and then check the accuracy of their line of best fit. This activity determines the correlation coefficient, r, for the true lines of best fit and also exposes students to residuals. This activity would work well in groups of two or three for about 10-15 minutes.
Place in Mathematics Curriculum
This activity can be used to:
- Teach students about how data influences the line of best fit.
- Provide students with practice in determining the line of best fit for some data.
- Introduce students to residuals.
- Allow students exploration with the linear correlation coefficient, r.
Standards Addressed
Grade 6
-
Statistics and Probability
- The student demonstrates an ability to analyze data (comparing, explaining, interpreting, evaluating; drawing or justifying conclusions).
Grade 7
-
Statistics and Probability
- The student demonstrates an ability to analyze data (comparing, explaining, interpreting, evaluating, making predictions; drawing or justifying conclusions).
Grade 8
-
Statistics and Probability
- The student demonstrates an ability to analyze data (comparing, explaining, interpreting, evaluating, making predictions, describing trends; drawing, formulating, or justifying conclusions).
Grade 9
-
Statistics and Probability
- The student demonstrates an ability to classify and organize data.
- The student demonstrates an ability to analyze data (comparing, explaining, interpreting, evaluating, making predictions, describing trends; drawing, formulating, or justifying conclusions).
Grade 10
-
Statistics and Probability
- The student demonstrates an ability to classify and organize data.
- The student demonstrates an ability to analyze data (comparing, explaining, interpreting, evaluating, making predictions, describing trends; drawing, formulating, or justifying conclusions).
Statistics and Probability
-
Interpreting Categorical and Quantitative Data
- Summarize, represent, and interpret data on two categorical and quantitative variables
- Interpret linear models
Grades 6-8
-
Algebra
- Use mathematical models to represent and understand quantitative relationships
-
Data Analysis and Probability
- Develop and evaluate inferences and predictions that are based on data
- Formulate questions that can be addressed with data and collect, organize, and display relevant data to answer them
- Select and use appropriate statistical methods to analyze data
Grades 9-12
-
Algebra
- Analyze change in various contexts
- Represent and analyze mathematical situations and structures using algebraic symbols
- Understand patterns, relations, and functions
- Use mathematical models to represent and understand quantitative relationships
-
Data Analysis and Probability
- Formulate questions that can be addressed with data and collect, organize, and display relevant data to answer them
- Select and use appropriate statistical methods to analyze data
Algebra I
-
Data Analysis and Probability
- Competency Goal 3: The learner will collect, organize, and interpret data with matrices and linear models to solve problems.
Technical Mathematics II
-
Data Analysis and Probability
- Competency Goal 2: The learner will use relations and functions to solve problems.
Advanced Functions and Modeling
-
Data Analysis and Probability
- Competency Goal 1: The learner will analyze data and apply probability concepts to solve problems.
Integrated Mathematics
-
Algebra
- Competency Goal 4: The learner will use relations and functions to solve problems.
-
Data Analysis and Probability
- Competency Goal 3: The learner will analyze data and apply probability concepts to solve problems.
Integrated Mathematics II
-
Algebra
- Competency Goal 4: The learner will use relations and functions to solve problems.
-
Data Analysis and Probability
- Competency Goal 3: The learner will collect, organize, and interpret data to solve problems.
AP Statistics
-
Algebra
- Competency Goal 4: The learner will analyze bivariate data to solve problems.
Textbooks Aligned
Grade Six
-
Data About Us
- Investigation Four: Coordinate Graphs
Grade Seven
-
Moving Straight Ahead
- Investigation One: Predicting from Patterns
- Investigation Two: Walking Rates
-
Variables and Patterns
- Investigation One: Variables and Coordinate Graphs
- Investigation Two: Graphing Change
- Investigation Three: Analyzing Graphs and Tables
Grade Eight
-
Samples and Populations
- Investigation One: Comparing Data Sets
-
Thinking with Mathematical Models
- Investigation One: Linear Models
- Investigation Two: Nonlinear Models
- Investigation Three: More Nonlinear Models
- Investigation Four: A World of Patterns
Book 2
-
Module 1 - Making Choices
- Section 1: Bar Graphs, Line Graphs
-
Module 2 - Search and Rescue
- Section 4: Graphing Functions
-
Module 5 - Recreation
- Section 2: Scatter Plots
-
Module 7 - Health and Wellness
- Section 1: Formulas and Graphs
- Section 1: Misleading Graphs
Book 3
-
Module 1 - Amazing Feats, Facts and Fictions
- Section 3: Scatter Plots
- Section 3: Fitting Lines
-
Module 3 - The Mystery of Blacktail Canyon
- Section 3: Slopes
-
Module 5 - Inventions
- Section 2: Slope
-
Module 8 - Making an Impact
- Section 3: Misleading Graphs
6th
-
Module 4 - Statistical Safari
- Section 5: Line Graphs and Choosing an Average
7th
-
Module 1 - Search and Rescue
- Section 4: Function Models
-
Module 2 - Bright Ideas
- Section 2: Interpreting Graphs
-
Module 5 - Recreation
- Section 3: Proportions and Plots
8th
-
Module 1 - Amazing Feats and Facts and Fiction
- Section 4: Scatter Plots
-
Module 3 - The Mystery of Blacktail Canyon
- Section 3: Slope and Equations
-
Module 6 - Visualizing Change
- Section 1: Graphs and Functions
Book 1
-
What Does the Data Say?
- Lesson 8: How Close Can You Get?
Book 3
-
Looking Behind the Numbers
- Lesson 5: Comparing Sizes
- Lesson 6: Is There a Relationship?
- Lesson 7: What Type of Relationship Is It?
- Lesson 8: The Mysterious Footprint
-
Mathematics of Motion
- Lesson 5: Walk This Way
Be Prepared to
- correlation.
- residuals.
- how to interpret the residual table and plot
- the linear correlation coefficient, r.
- independent and dependent variables.