What is Multiple Linear Regression?
Correlation and regression are used in statistical analysis to determine the strength of the relationship between two variables. For example, variables such as these may be correlated:
- A person's age vs. height
- Hour's studied for a test vs. test score
- Speed vs. time it takes to travel ten miles
Correlation is used to determine the strength as well as the direction of the relationship between the variables. Two variables are positively correlated if as one variable increases, the other also increases. Negative correlation is when one variable increases but the other decreases. Linear Regression is used to find the line of best-fit, meaning the line about which the data points are scattered. Positive and negative correlations correspond to the slope of the best-fit line. The correlation coefficient is a measure of the strength of the relationship.
Multiple regressions are used when trying to determine a good indicator for a random variable. For example, if you were looking to buy a new car, you could use the price of the car as your dependant variable. Then you could test its correlation to "predictor" variables such as horsepower, gas efficiency, resale value, crash safety rating, etc. After doing the analysis, you might find that a car's crash safety rating is a better indicator of the overall price of the car than how many seats it has. You may also discover certain cars that should be priced more or less given its characteristics, thus being able to identify the best car for the price.
How Do I Use This Activity?
This activity is designed to help students compare multiple independent variables as predictors of one dependent variable. Students may explore correlation and lines of best-fit.
Controls and Output
Entering Data
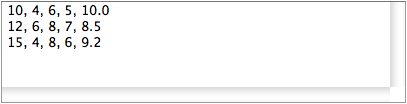
First, the user needs to input their data. To do this, each line must contain 5 pieces of
data. First is the dependent variable. In our car example, this is where we would put the
price of each car. Next is the independent variable for dimension 1, then dimension 2, and so
on. In the past, you've probably seen similar coordinates for points on a plane, where the x-
and y-values represent certain qualities of the points (namely, their location). For this
applet, each dimension also represents some quality about the car. The five dimensions are
("price", "cup holders", "engine (liters)", "resale value", and "safety rating"), so the line
of data for a car that has a price of $10,000, 4 cup holders, a six liter engine, a resale
value of half its original price, and a perfect safety rating on scale out of 10 would be (10,
4, 6, 5, 10).
After clicking
Update Data, each of the four dimensions will be graphed against the dependent variable and two lines
will appear on each graph.

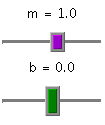
Green Best–Fit Line
To adjust the green best–fit line, use the purple and green slider bars to adjust the
slope and y–intercept respectively. The sliders' range is [–10,9.5]
thus making it impossible to graph a vertical line. If the best–fit line is a vertical
line, the red equation will output the equation of a vertical line (i.e. x=3).
To judge how accurate the user adjusted green best-fit line is, the sum of the squares of the
differences is shown in the lower right hand corner.
These squares can be summed up over all four dimensions or viewed individually by selecting
and unselecting the
Include in sum of squares checkbox.
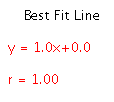
Red Best–Fit Line
The equation and correlation, r, are calculated for the red best fit line to determine how
well the data is represented by the line. For more information on correlation, view the
discussion on
Correlation Coefficients.
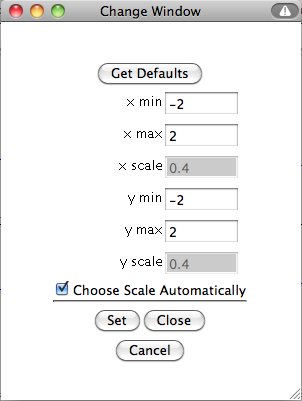
Adjusting the Window To adjust the window of the graphs, input the desired values for minimum and maximum x and y
then click
Set Window. Note that
X Min must be less than
X Max and the same for
Y Min and
Y Max.
Description
The multiple regression applet is designed to allow the user to plot one dependent variable against four independent variables in an attempt to find a good indicator of the dependent variable. The applet automatically calculates the best-fit line for each dimension of data and its corresponding r-value. But for the user adjusted best-fit line, only the sum of squares of deviations is displayed. This is especially important in a case where one of the dimensions has a correlation of zero. Although you can change the slope and y-intercept of the green best-fit line to reduce the sum of squares, you are not changing the ability of that dimension to predict the dependent variable. Thus, changing the best-fit line to reduce the sum of squares can't possibly increase that dimension's lack of influence on the other dimensions.
This activity would be good for individuals or small groups for about twenty to twenty-five minutes when used with the exploration questions.
Place in Mathematics Curriculum
This activity can be used to:
- Teach students about how data influences the line of best fit
- Provide students with practice in determining the line of best fit
- Allow students exploration with the linear correlation coefficient
- Teach students about the uses of multiple regression
- Continue the distinction between independent and dependent variables
Standards Addressed
Grade 9
-
Statistics and Probability
- The student demonstrates an ability to analyze data (comparing, explaining, interpreting, evaluating, making predictions, describing trends; drawing, formulating, or justifying conclusions).
Grade 10
-
Statistics and Probability
- The student demonstrates an ability to analyze data (comparing, explaining, interpreting, evaluating, making predictions, describing trends; drawing, formulating, or justifying conclusions).
Grades 8-12
-
AP Probability and Statistics
- 12.0 Students find the line of best fit to a given distribution of data by using least squares regression.
Statistics and Probability
-
Interpreting Categorical and Quantitative Data
- Interpret linear models
Grades 9-12
-
Data Analysis and Probability
- Formulate questions that can be addressed with data and collect, organize, and display relevant data to answer them
- Select and use appropriate statistical methods to analyze data
Technical Mathematics II
-
Data Analysis and Probability
- Competency Goal 2: The learner will use relations and functions to solve problems.
Advanced Functions and Modeling
-
Data Analysis and Probability
- Competency Goal 1: The learner will analyze data and apply probability concepts to solve problems.
Discrete Mathematics
-
Data Analysis and Probability
- Competency Goal 2: The learner will analyze data and apply probability concepts to solve problems.
Integrated Mathematics II
-
Data Analysis and Probability
- Competency Goal 3: The learner will collect, organize, and interpret data to solve problems.
Integrated Mathematics IV
-
Data Analysis and Probability
- Competency Goal 3: The learner will analyze data to solve problems.
AP Statistics
-
Data Analysis and Probability
- Competency Goal 3: The learner will collect and analyze data to solve problems.
Algebra II
-
Data Analysis and Probability
- The student will collect, organize, represent, and interpret data; make and evaluate inferences and predictions; present and evaluate arguments based on data analysis; and model situations to determine theoretical and experimental probabilities.
Algebra I
-
Linear Functions
- 5. The student understands that linear functions can be represented in different ways and translates among their various representations.
- 6. The student understands the meaning of the slope and intercepts of the graphs of linear functions and zeros of linear functions and interprets and describes the effects of changes in parameters of linear functions in real-world and mathematical situations.
Mathematical Models with Applications
-
Knowledge and Skills
- 3. The student develops and implements a plan for collecting and analyzing data (qualitative and quantitative) in order to make decisions.
Secondary
-
Probability and Statistics
- PS.5 The student will find and interpret linear correlation, use the method of least squares regression to model the linear relationship between two variables, and use the residual plots to assess linearity. Appropriate technology will be used to compute
- PS.05 The student will find and interpret linear correlation, use the method of least squares regression to model the linear relationship between two variables, and use the residual plots to assess linearity. Appropriate technology will be used to compute correlation coefficients and residual plots.
Be Prepared to
- Explain positive/negative correlation and the correlation coefficient, r
- Relate correlation and the best-fit line
- Explain independent and dependent variables
- Introduce independent variables as indicators/predictors