What is Advanced Fire?
This activity allows the user to see the results of a fire if a forest is densely planted in a rectangular grid. The probability that a tree will burn is set, and the fire is started. Each tree has the same probability that it will burn or not, given that its neighbor is on fire.
The behavior of this activity is chaotic since we cannot predict in advance whether a particular tree is burned or not, and small changes in the set probability, forest size, and the location of the initial burning can radically alter the final state of the forest. However, general patterns in the burning of the trees can be seen for particular probabilities. This applet allows the user to adjust a variety of initial parameters and look for patterns in the resulting fire. In particular, the "burn history" allows the user to track every burn until the history is cleared.
This fire is somewhat unrealistic since in most fires, if a tree has a close neighbor on fire it will likely catch fire unless the wind changes.
How Do I Use This Activity?
This activity allows the user to see the results of a fire if a forest is densely planted in a rectangular grid.
Controls and Output
Running the Applet:
-
The probability choice menu on the top-left side of the applet allows you to choose a
probability that an individual tree will burn when an adjacent tree is on fire.
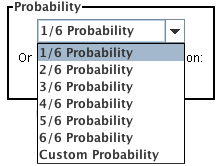
-
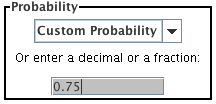
If you select Custom Probability, you must use the text field to enter a decimal value
between 0.00 and 1.00 or a fraction between 0 and 1 as the probability that an individual
tree will burn when an adjacent tree is on fire.
-
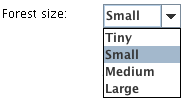
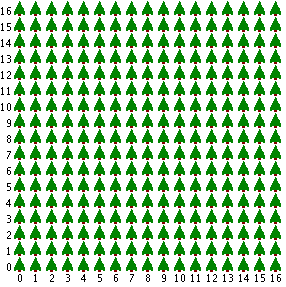
Located directly below the probability choice menu, the
Select A Forest Size drop down menu gives you the option of choosing the size of the forest. The forest can be
one of four sizes tiny (10x10), small (16x16), medium (26x26) or large (34x34).
-
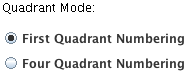
Each forest size can then be adjusted to use
First Quadrant Numbering or
Four Quadrant Numbering. If you choose First Quadrant Numbering the scale range will be positive, if you use the
four quadrant numbering the scale will range from negative to positive with the middle
point at (0,0).
-
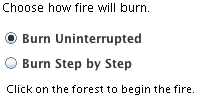
You can choose how the fire burns by clicking the button beside
Burn Uninterrupted or
Burn Step By Step.
 If you choose step by step, you must click on the
Step Through Fire button after you start the burn and keep clicking on it until the fire burns completely.
If you choose step by step, you must click on the
Step Through Fire button after you start the burn and keep clicking on it until the fire burns completely.

-
In order to start the fire, you must click a tree in the forest grid. The fire will then
begin at that tree and spread throughout the forest according to the initial parameters
that you set.
-
After burning the forest, you must click the
Re-grow Forest button before starting another fire.

-
The
Highlight Center Tree button highlights the center tree in blue, when you click it again it highlights the
center row and column, and a third click hides all highlighting.

-
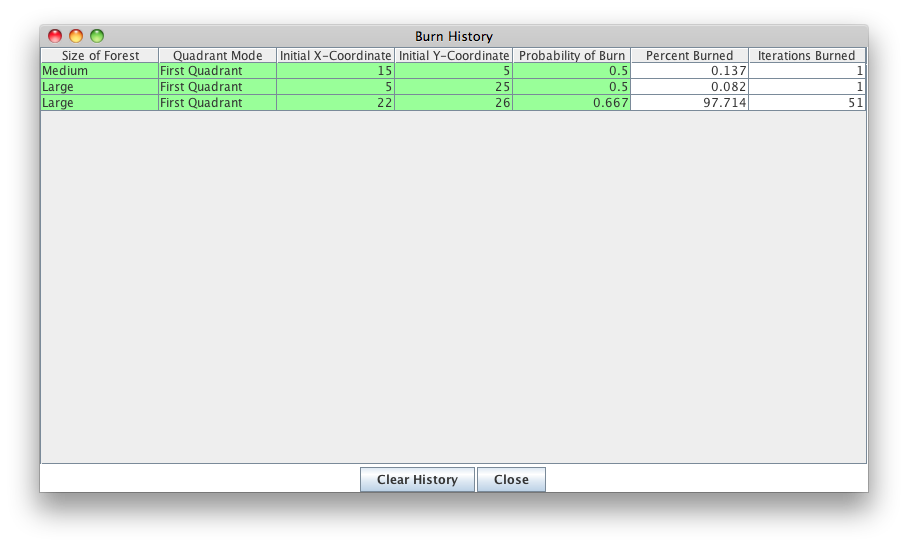
To see the history of all burns, click the
Show Burn History button.
 The
Show Burn History button opens a new window with the initial settings (Forest Size, Quadrant Mode, Initial
Coordinates, and Probability of Burn) as well as the characteristics of the resulting fire
(Percent Burned and Iterations Burned). The percent burned is the percentage of trees
burned at the completion of the fire as a percentage of the total number of trees in the
forest. The iterations burned is the total number of iterations run before the fire ends.
Each step where the fire spreads from some number of trees to more trees based on the
probability of burn is an iteration.
The
Show Burn History button opens a new window with the initial settings (Forest Size, Quadrant Mode, Initial
Coordinates, and Probability of Burn) as well as the characteristics of the resulting fire
(Percent Burned and Iterations Burned). The percent burned is the percentage of trees
burned at the completion of the fire as a percentage of the total number of trees in the
forest. The iterations burned is the total number of iterations run before the fire ends.
Each step where the fire spreads from some number of trees to more trees based on the
probability of burn is an iteration.
 *Note that the "steps" seen when you "step through the fire" are animation steps and not
necessarily iterations.
*Note that the "steps" seen when you "step through the fire" are animation steps and not
necessarily iterations.
-
You may clear the history at any point by clicking the
Clear Burn History button.

- In order to copy the data, click and drag the mouse over the data you wish to copy. Then press the control or command key and the letter "c" key at the same time. Using your preferred modeling program (e.g., Microsoft Excel), you may now paste the data.
Description
This activity allows the user to see the results of a fire if a forest is densely planted in a rectangular grid with variations in probability and forest size. The students can adjust a variety of settings that affect how the forest burns. The "burn history" that is recorded for students is an excellent data set that can be analyzed for patterns. To do this, students can copy the data and paste it into another tool (e.g., Microsoft Excel) to create graphs and interpret the data.
This activity is an excellent example for a lesson in scientific experimentation because it motivates students to discover what makes a good experiment. This activity would work well in mixed ability groups for about thirty to forty minutes with the Advanced Fire Worksheet or fifteen to twenty minutes without.
Place in Mathematics Curriculum
This activity can be used to:
- demonstrate the basic concepts of probability
- demonstrate the concept of chaos
- practice accurate scientific experimentation
- learn and practice data analysis
Standards Addressed
Grade 6
-
Statistics and Probability
- The student demonstrates a conceptual understanding of probability and counting techniques.
Grade 7
-
Statistics and Probability
- The student demonstrates a conceptual understanding of probability and counting techniques.
Grade 8
-
Statistics and Probability
- The student demonstrates a conceptual understanding of probability and counting techniques.
Grade 9
-
Statistics and Probability
- The student demonstrates a conceptual understanding of probability and counting techniques.
Grade 10
-
Statistics and Probability
- The student demonstrates a conceptual understanding of probability and counting techniques.
Seventh Grade
-
Statistics and Probability
- Investigate chance processes and develop, use, and evaluate probability models.
Number and Quantity
-
Quantities
- Reason quantitatively and use units to solve problems.
Statistics and Probability
-
Conditional Probability and the Rules of Probability
- Understand independence and conditional probability and use them to interpret data
- Use the rules of probability to compute probabilities of compound events in a uniform probability model
-
Making Inferences and Justifying Conclusions
- Understand and evaluate random processes underlying statistical experiments
- Make inferences and justify conclusions from sample surveys, experiments, and observational studies
-
Using Probability to Make Decisions
- Calculate expected values and use them to solve problems
- Use probability to evaluate outcomes of decisions
Grades 6-8
-
Algebra
- Use mathematical models to represent and understand quantitative relationships
-
Data Analysis and Probability
- Develop and evaluate inferences and predictions that are based on data
- Formulate questions that can be addressed with data and collect, organize, and display relevant data to answer them
- Select and use appropriate statistical methods to analyze data
Grades 9-12
-
Algebra
- Use mathematical models to represent and understand quantitative relationships
-
Data Analysis and Probability
- Formulate questions that can be addressed with data and collect, organize, and display relevant data to answer them
- Select and use appropriate statistical methods to analyze data
- Understand and apply basic concepts of probability
Grade 6
-
Number and Operations, Measurement, Geometry, Data Analysis and Probability, Algebra
- COMPETENCY GOAL 4: The learner will understand and determine probabilities.
Grade 7
-
Number and Operations, Measurement, Geometry, Data Analysis and Probability, Algebra
- COMPETENCY GOAL 4: The learner will understand and use graphs and data analysis.
Grade 8
-
Number and Operations, Measurement, Geometry, Data Analysis and Probability, Algebra
- COMPETENCY GOAL 4: The learner will understand and use graphs and data analysis.
Advanced Functions and Modeling
-
Data Analysis and Probability
- Competency Goal 1: The learner will analyze data and apply probability concepts to solve problems.
Integrated Mathematics
-
Data Analysis and Probability
- Competency Goal 3: The learner will analyze data and apply probability concepts to solve problems.
AP Statistics
-
Data Analysis and Probability
- Competency Goal 3: The learner will collect and analyze data to solve problems.
Grade 6
-
Probability and Statistics
- 10. The student uses statistical representations to analyze data.
Grade 7
-
Probability and Statistics
- 10. The student recognizes that a physical or mathematical model (including geometric) can be used to describe the experimental and theoretical probability of real-life events.
Grade 8
-
Probability and Statistics
- 11. The student applies concepts of theoretical and experimental probability to make predictions.
- 12. The student uses statistical procedures to describe data.
- 13. The student evaluates predictions and conclusions based on statistical data.
7th Grade
-
Probability and Statistics
- 7.18 The student will make inferences, conjectures, and predictions based on analysis of a set of data.
Be Prepared to
- explain why the probability selected is not always similar to the percentage of trees burned
- explain why a tree near a burning tree might not catch fire
- explain the concept of "control" in a scientific experiment