What is Fire!!?
This activity allows the user to see the results of a fire if a forest is densely planted in a rectangular grid.
The probability that a tree will burn is set, and the fire is started. For each tree the same probability "die" is thrown to see if that tree will burn or not, given that its neighbor is on fire.
The behavior of this activity is chaotic, since we cannot predict in advance whether a particular tree is burned or not, and since small changes in the set probability and the location of the initial burning can radically alter the final state of the forest. However, general patterns in the burning of the trees can be seen for particular probabilities.
This fire is somewhat unrealistic since in most fires, if a tree has a close neighbor on fire it will catch fire, too, unless the wind changes.
How Do I Use This Activity?
This activity allows the user to see the results of a fire if a forest is densely planted in a rectangular grid.
Controls and Output
-
The
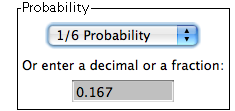
Select A Probability choice menu on the top-left side of the applet allows you to choose a probability that an
individual tree will burn when the fire reaches it.
-
The
Custom Probability text field on the left side of the applet allows you to enter a decimal value between
0.00 and 1.00 or a fraction between 0 and 1 as the probability that an individual tree
will burn when the fire reaches it.
-
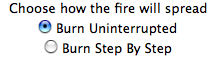
You can choose how the fire burns by clicking the button beside
Burn Uninterrupted or
Burn Step By Step.
-
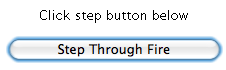
If you choose step by step you must click on the
Step Through Fire button and keep clicking on it until the fire burns completely.
 Note that the number of clicks for "Step Through Fire" will only determine the number of
animation steps, not the number of iterations.
Note that the number of clicks for "Step Through Fire" will only determine the number of
animation steps, not the number of iterations.
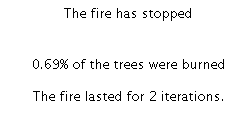 The iterations burned is the total number of iterations run before the fire ends. Each
step where the fire spreads from some number of trees to more trees based on the
probability of burn is an iteration.
The iterations burned is the total number of iterations run before the fire ends. Each
step where the fire spreads from some number of trees to more trees based on the
probability of burn is an iteration.
-
The
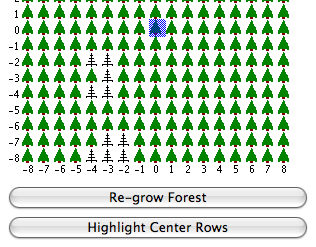
Tree Display is where you will need to click to start the fire in a certain place in the forest.
-
The
Re-Grow Forest button revitalizes the forest after it has been burned.
- The Highlight Center Tree button highlights the center tree in blue, when you click it again it highlights the center rows, and to hide this click the button a third time.
After you have finished with this activity you might want to check out some of the other fire activities to help with percents, probability, and modeling.
Description
This activity allows the user to see the results of a fire if a forest is densely planted in a rectangular grid. This activity would work well in mixed ability groups of two for about thirty to thirty-five minutes if you use the exploration questions and ten to fifteen minutes otherwise.
Place in Mathematics Curriculum
This activity can be used to:
- demonstrate randomness
- motivate the ideas of chaos
- demonstrate the basic concepts of probability
Standards Addressed
Grade 3
-
Statistics and Probability
- The student demonstrates a conceptual understanding of probability.
Grade 4
-
Statistics and Probability
- The student demonstrates a conceptual understanding of probability and counting techniques.
Grade 5
-
Statistics and Probability
- The student demonstrates a conceptual understanding of probability and counting techniques.
Grade 6
-
Statistics and Probability
- The student demonstrates a conceptual understanding of probability and counting techniques.
Grade 7
-
Statistics and Probability
- The student demonstrates a conceptual understanding of probability and counting techniques.
Grade 8
-
Statistics and Probability
- The student demonstrates a conceptual understanding of probability and counting techniques.
Grade 9
-
Statistics and Probability
- The student demonstrates a conceptual understanding of probability and counting techniques.
Grade 10
-
Statistics and Probability
- The student demonstrates a conceptual understanding of probability and counting techniques.
Grade 3
-
Statistics, Data Analysis, and Probability
- 1.0 Students conduct simple probability experiments by determining the number of possible outcomes and make simple predictions
Grade 4
-
Statistics, Data Analysis, and Probability
- 2.0 Students make predictions for simple probability situations
Seventh Grade
-
Statistics and Probability
- Investigate chance processes and develop, use, and evaluate probability models.
Number and Quantity
-
Quantities
- Reason quantitatively and use units to solve problems.
Statistics and Probability
-
Conditional Probability and the Rules of Probability
- Understand independence and conditional probability and use them to interpret data
- Use the rules of probability to compute probabilities of compound events in a uniform probability model
-
Making Inferences and Justifying Conclusions
- Understand and evaluate random processes underlying statistical experiments
- Make inferences and justify conclusions from sample surveys, experiments, and observational studies
-
Using Probability to Make Decisions
- Calculate expected values and use them to solve problems
- Use probability to evaluate outcomes of decisions
Grades 3-5
-
Data Analysis and Probability
- Develop and evaluate inferences and predictions that are based on data
- Formulate questions that can be addressed with data and collect, organize, and display relevant data to answer them
- Understand and apply basic concepts of probability
Grades 6-8
-
Algebra
- Use mathematical models to represent and understand quantitative relationships
-
Data Analysis and Probability
- Develop and evaluate inferences and predictions that are based on data
- Formulate questions that can be addressed with data and collect, organize, and display relevant data to answer them
-
Numbers and Operations
- Understand meanings of operations and how they relate to one another
Grades 9-12
-
Algebra
- Use mathematical models to represent and understand quantitative relationships
-
Data Analysis and Probability
- Develop and evaluate inferences and predictions that are based on data
Grade 6
-
Number and Operations, Measurement, Geometry, Data Analysis and Probability, Algebra
- COMPETENCY GOAL 1: The learner will understand and compute with rational numbers.
- COMPETENCY GOAL 4: The learner will understand and determine probabilities.
Grade 7
-
Number and Operations, Measurement, Geometry, Data Analysis and Probability, Algebra
- COMPETENCY GOAL 1: The learner will understand and compute with rational numbers.
Advanced Functions and Modeling
-
Data Analysis and Probability
- Competency Goal 1: The learner will analyze data and apply probability concepts to solve problems.
Integrated Mathematics
-
Data Analysis and Probability
- Competency Goal 3: The learner will analyze data and apply probability concepts to solve problems.
AP Statistics
-
Data Analysis and Probability
- Competency Goal 3: The learner will collect and analyze data to solve problems.
-
Number and Operations
- Competency Goal 1: The learner will analyze univariate data to solve problems.
7th Grade
-
Data Analysis and Probability
- The student will demonstrate through the mathematical processes an understanding of the relationships between two populations or samples.
Intermediate Algebra
-
Algebra
- The student will understand and utilize the mathematical processes of problem solving, reasoning and proof, communication, connections, and representation.
Grade 5
-
Probability and Statistics
- 12. The student describes and predicts the results of a probability experiment.
Grade 6
-
Probability and Statistics
- 9. The student uses experimental and theoretical probability to make predictions.
Grade 8
-
Probability and Statistics
- 11. The student applies concepts of theoretical and experimental probability to make predictions.
7th Grade
-
Computation and Estimation
- 7.6 The student will use proportions to solve practical problems, which may include scale drawings, that contain rational numbers (whole numbers, fractions, and decimals) and percents.
Be Prepared to
- give implicit directions on what they are to do. For example, "Today we are going to run a set ofexperiments and answer the questions on the worksheet..."
- answer the question "Why does it burn one or two trees but say that 0% was burned?"