What is Dice Table?
This activity allows the user to calculate the probability of each number (2-12) appearing when two dice are rolled. They also get practice converting probabilities into fractions, decimals, and percentages. Each number outcome can have more than one possible combination to make that number. For example the outcome of six has the possible combinations of 5+1, 4+2, and 3+3. Another term used in probability is permutations. This word refers to the arrangement of the values, for example 4+2=6 and 2+4=6.
Probability began in the middle of the seventeenth century by a man named Pascal. One day a man proposed a question about gambling. His question was "If I play a game that I have eight rolls to roll a six and I fail the first three times, how much of my bet should I get back?" The game involved chance just as most of games do now, such as Monopoly and card games. Las Vegas is a city that is dominated by people that have invested in this field of mathematics. Today, probability has found its way into the fields of science, medicine and statistics.
How Do I Use This Activity?
This activity allows the user to calculate the probability of each number (2-12) appearing when two dice are rolled, as well as get practice converting probabilities into fractions, decimals, and percentages.
Controls and Output
-
To assign a winning sum
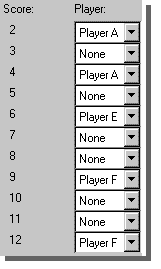
(Score) to a player, select the player's name next to the score by clicking on the selection
sign:
 next to that score, and then on the player's name; in the list that will appear. In our
example, Player A wins if the score is 2 or 4, Player E wins if the sum is 6, and Player F
wins if the sum is 9 or 12. Nobody wins if the dice produce the rest of the possible sums:

-
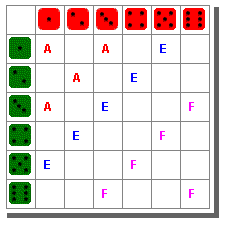
The winning combinations of dice numbers for each player is shown in a table. For example,
Player E (whose winning sum we set to be 6) wins for five different combinations of
numbers on the green and red dice (Green 1 Red 5; Green 2 Red 4; Green 3 Red 3; Green 4
Red 2; and Green 5 Red 1):

-
To study a particular player in detail, choose this player in the
Select a player [____]
 menu by clicking on the selection sign:
 , and then on the player's name in the list that will appear. In our example, Player A is
selected:

- To check the probability of winning for the selected player, use any of the four expressions of the probability, as follows.
-
To check the probability by outcomes, type the numbers of outcomes for the player in the
Q#1: The player wins in [____] out of [____] outcomes spaces. In our example, Player A wins in 4 out of 36 outcomes:

-
Then click on the
check #1 button to have the software verify your answer:x

-
To check the probability by fractions, type the numerator and the denominator of the
probability of the player winning in the
Q#2: The probability to win as a simple fraction is [____] / [____] spaces. For Player A, the probability of winning is 1/9:

-
Then click on the
check #2 button to have the software verify your answer:

-
To check the probability by decimals, type the probability of the player winning in the
decimal form (rounded to four digits after the decimal point) in the
Q#3: The same probability in decimal form rounded to four places is [____] space. For Player A, the probability of winning is .1111:

-
Then click on the
check #3 button to have the software verify your answer:

-
To check the probability by percents, type the probability of the player winning in
percents (rounded to two decimal places) in the
Q#4: The same probability in percents rounded to two decimal places is [____] space. For Player A, the probability of winning is 11.11%:

-
Then click on the
check #4 button to have the software verify your answer:

Description
This activity allows the user to calculate the probability of each number (2-12) appearing when two dice are rolled. This activity would work well in same ability groups of two to four for about twenty to twenty-five minutes if you use the exploration questions and ten minutes otherwise.
Place in Mathematics Curriculum
This activity can be used to:
- practice students' fraction, decimal and percent manipulation skills
- introduce the notions of chance and probability
- motivate the notion of random numbers
- motivate ideas from combinatorics
Standards Addressed
Grade 6
-
Statistics and Probability
- The student demonstrates a conceptual understanding of probability and counting techniques.
Grade 7
-
Statistics and Probability
- The student demonstrates a conceptual understanding of probability and counting techniques.
Grade 8
-
Statistics and Probability
- The student demonstrates a conceptual understanding of probability and counting techniques.
Grade 9
-
Statistics and Probability
- The student demonstrates a conceptual understanding of probability and counting techniques.
Grade 10
-
Statistics and Probability
- The student demonstrates a conceptual understanding of probability and counting techniques.
Seventh Grade
-
Statistics and Probability
- Investigate chance processes and develop, use, and evaluate probability models.
Statistics and Probability
-
Conditional Probability and the Rules of Probability
- Understand independence and conditional probability and use them to interpret data
- Use the rules of probability to compute probabilities of compound events in a uniform probability model
-
Making Inferences and Justifying Conclusions
- Understand and evaluate random processes underlying statistical experiments
- Make inferences and justify conclusions from sample surveys, experiments, and observational studies
-
Using Probability to Make Decisions
- Calculate expected values and use them to solve problems
- Use probability to evaluate outcomes of decisions
Grades 6-8
-
Data Analysis and Probability
- Understand and apply basic concepts of probability
Grades 9-12
-
Data Analysis and Probability
- Develop and evaluate inferences and predictions that are based on data
- Formulate questions that can be addressed with data and collect, organize, and display relevant data to answer them
- Understand and apply basic concepts of probability
Grade 6
-
Number and Operations, Measurement, Geometry, Data Analysis and Probability, Algebra
- COMPETENCY GOAL 4: The learner will understand and determine probabilities.
Advanced Functions and Modeling
-
Data Analysis and Probability
- Competency Goal 1: The learner will analyze data and apply probability concepts to solve problems.
Discrete Mathematics
-
Data Analysis and Probability
- Competency Goal 2: The learner will analyze data and apply probability concepts to solve problems.
Integrated Mathematics
-
Data Analysis and Probability
- Competency Goal 3: The learner will analyze data and apply probability concepts to solve problems.
AP Statistics
-
Data Analysis and Probability
- Competency Goal 3: The learner will collect and analyze data to solve problems.
-
Number and Operations
- Competency Goal 1: The learner will analyze univariate data to solve problems.
6th Grade
-
Data Analysis and Probability
- The student will demonstrate through the mathematical processes an understanding of the relationships within one population or sample.
4th Grade
-
Data Analysis and Probability
- Standard 4-6: The student will demonstrate through the mathematical processes an understanding of the impact of data-collection methods, the appropriate graph for categorical or numerical data, and the analysis of possible outcomes for a simple event.
7th Grade
-
Data Analysis and Probability
- The student will demonstrate through the mathematical processes an understanding of the relationships between two populations or samples.
8th Grade
-
Data Analysis and Probability
- The student will demonstrate through the mathematical processes an understanding of the relationships between two variables within one population or sample.
Grade 6
-
Probability and Statistics
- 9. The student uses experimental and theoretical probability to make predictions.
Grade 8
-
Probability and Statistics
- 11. The student applies concepts of theoretical and experimental probability to make predictions.
7th Grade
-
Probability and Statistics
- 7.14 The student will investigate and describe the difference between the probability of an event found through simulation versus the theoretical probability of that same event.
- 7.15 The student will identify and describe the number of possible arrangements of several objects, using a tree diagram or the Fundamental (Basic) Counting Principle.
4th Grade
-
Probability and Statistics
- 4.19.b
5th Grade
-
Probability and Statistics
- 5.17b The student will predict the probability of outcomes of simple experiments, representing it with fractions or decimals from 0 to 1, and test the prediction
8th Grade
-
Computation and Estimation
- 8.3 The student will solve practical problems involving rational numbers, percents, ratios, and proportions. Problems will be of varying complexities and will involve real-life data, such as finding a discount and discount prices and balancing a checkbook.
- 8.3 The student will solve practical problems involving rational numbers, percents, ratios, and proportions. Problems will be of varying complexities and will involve real-life data,
-
Probability and Statistics
- 8.11 The student will analyze problem situations, including games of chance, board games, or grading scales, and make predictions, using knowledge of probability.
- 8.11 The student will analyze problem situations, including games of chance, board games, or
Textbooks Aligned
Book 1
-
Module 4 - Mind Games
- Section 1: Experimental Probability
- Section 1: Theoretical Probability
Book 3
-
Module 5 - Inventions
- Sectoin 5: Counting Principles, Permutations, Combinations, Probability and Counting
Be Prepared to
- permit calculators or stop the whining about not having calculators quickly and permanently
- answer the question "How do I change a fraction to a decimal?"
- discuss ways to convert from fractions to decimal to percentages and back.