What is Incline?
This applet allows the user to make observations about the relationship between speed and position and how both of these are affected by initial velocity and the incline on which the biker is traveling. As the biker travels up and down an incline, speed changes proportionally to height off of the ground. On the graph opposite, the biker's speed is displayed in relationship to his horizontal position on the path, so his speed is defined as the dependent variable, and his position as the independent variable. For more information on this, see the discussion on dependent and independent variables.
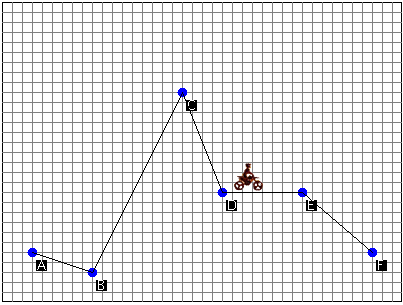
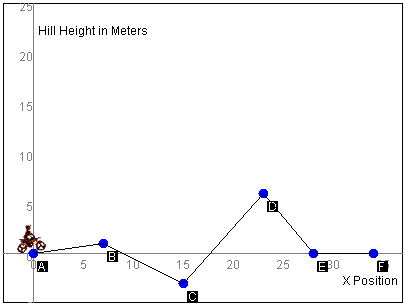
The user may explore these relationships by adjusting the incline of the biker's path as shown
in the picture below:
The user may also adjust the biker's initial velocity. Be careful, though! A low initial velocity and a tall incline may result in the biker's inability to travel the entire course. This is due to insufficient energy in the system, a topic explored further in the discussion on energy.
How Do I Use This Activity?
This activity allows the user to understand the effect of potential and kinetic energy on velocity. As the biker travels on the path you set for him, speed will increase, decrease, or remain constant based on the incline of the path.
Controls and Output
To adjust the biker's path, click and drag on each of the points B, C, D, and E. Points A and
F are the endpoints of the ramp and, as such, cannot be moved. As you do so, note that the
path between the points changes to match.
To reset the ramp to its initial configuration, press the
Reset Ramp button.

To adjust the velocity that the biker starts with, click and drag the Initial Velocity slider bar. Setting the initial velocity too low may mean that the biker doesn't have enough energy to get all the way up the incline. If this happens, the biker will stop when he runs out of energy.
To sketch a prediction of the graph before running the simulation, click and drag the mouse
across the graph.
Press the Start Animation button to begin the animation. While the animation is running, the button will toggle to say Pause Animation. The button can then be used to pause the animation at any point. When the animation is paused, the button will toggle to say Resume. The button can then be used to resume the animation where it was paused.


As an alternate to running the animation automaticallly, press the
Step Animation button in order to manually move the biker each step of the animation.

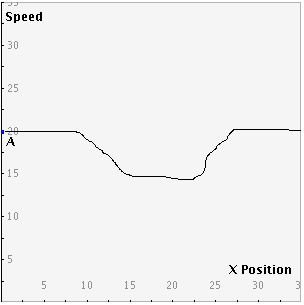
As the animation runs, the graph on the right will update to show the change in speed versus
position.
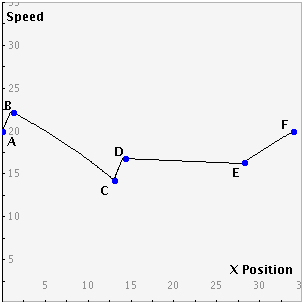 The line on the graph represents the speed of the biker as he travels along the path. Notice
that as the biker moves up an incline, the line on the graph moves down because the biker
loses speed. Likewise, when the biker moves down an incline, the line on the graph moves up as
the biker's speed increases.
The line on the graph represents the speed of the biker as he travels along the path. Notice
that as the biker moves up an incline, the line on the graph moves down because the biker
loses speed. Likewise, when the biker moves down an incline, the line on the graph moves up as
the biker's speed increases.
To run another animation, press the
Reset Animation button. This will move the biker back to the starting position, ready for another run.

Pressing the
Reset Animation will clear the speed vs. position graph. In order to prevent this, check the
Trace Multiple Runs checkbox. Checking this box will cause the graph to display all subsequent runs
simultaneously. This option is useful if you wish to compare various configurations of the
ramp and initial velocity side by side.

Description
This activity demonstrates the relationship between dependent and independent variables by allowing students to explore a real life example. After adjusting the biker's path and the initial velocity, the user can analyze the resulting speed vs. position graph.
This activity includes physics concepts, algebraic thinking, and computational modeling, making it an ideal cross-content, real-world example. Students are able to practice at reading and interpreting graphs while also learning about other concepts.
This activity would work well in mixed ability groups of up to four students for about twenty-five to thirty minutes if you use the exploration questions, or about ten to fifteen minutes otherwise.
Place in Mathematics Curriculum
This activity can be used to:
- introduce the concept of computational modeling
- demonstrate the basic concepts of kinetic and potential energy
- demonstrate the relationship between independent and dependent variables
- introduce the concept of a nonlinear relationships between variables
- give students practice at reading and interpreting graphs
Standards Addressed
Grade 6
-
Functions and Relationships
- The student demonstrates conceptual understanding of functions, patterns, or sequences.
- The student demonstrates algebraic thinking.
Grade 7
-
Functions and Relationships
- The student demonstrates conceptual understanding of functions, patterns, or sequences including those represented in real-world situations.
- The student demonstrates algebraic thinking.
Grade 8
-
Functions and Relationships
- The student demonstrates conceptual understanding of functions, patterns, or sequences including those represented in real-world situations.
- The student demonstrates algebraic thinking.
Grade 9
-
Functions and Relationships
- The student demonstrates conceptual understanding of functions, patterns, or sequences including those represented in real-world situations.
- The student demonstrates algebraic thinking.
Grade 10
-
Functions and Relationships
- The student demonstrates conceptual understanding of functions, patterns, or sequences including those represented in real-world situations.
- The student demonstrates algebraic thinking.
Seventh Grade
-
Expressions and Equations
- Solve real-life and mathematical problems using numerical and algebraic expressions and equations.
Eighth Grade
-
Functions
- Use functions to model relationships between quantities.
Algebra
-
Creating Equations
- Create equations that describe numbers or relationships
-
Seeing Structure in Expressions
- Interpret the structure of expressions
Functions
-
Interpreting Functions
- Interpret functions that arise in applications in terms of the context
Grades 6-8
-
Algebra
- Analyze change in various contexts
- Understand patterns, relations, and functions
Grades 9-12
-
Algebra
- Analyze change in various contexts
- Understand patterns, relations, and functions
Grade 7
-
Number and Operations, Measurement, Geometry, Data Analysis and Probability, Algebra
- COMPETENCY GOAL 5: The learner will demonstrate an understanding of linear relations and fundamental algebraic concepts.
Algebra I
-
Algebra
- Competency Goal 4: The learner will use relations and functions to solve problems.
Algebra II
-
Algebra
- Competency Goal 2: The learner will use relations and functions to solve problems.
Elementary Algebra
-
Elementary Algebra
- Standard EA-3: The student will demonstrate through the mathematical processes an understanding of relationships and functions.
Intermediate Algebra
-
Algebra
- The student will demonstrate through the mathematical processes an understanding of functions, systems of equations, and systems of linear inequalities.
- The student will demonstrate through the mathematical processes an understanding of algebraic expressions and nonlinear functions.
6th Grade
-
Algebra
- Content Standard 2.0 The student will understand and generalize patterns as they represent and analyze quantitative relationships and change in a variety of contexts and problems using graphs, tables, and equations.
7th Grade
-
Algebra
- The student will understand and generalize patterns as they represent and analyze quantitative relationships and change in a variety of contexts and problems using graphs, tables, and equations.
8th Grade
-
Algebra
- The student will understand and generalize patterns as they represent and analyze quantitative relationships and change in a variety of contexts and problems using graphs, tables, and equations.
Algebra I
-
Algebra
- Students will describe, extend, analyze, and create a wide variety of patterns and functions using appropriate materials and representations in real world problem solving.
Algebra II
-
Algebra
- Students will describe, extend, analyze, and create a wide variety of patterns and functions using appropriate materials and representations in real-world problem solving, and will demonstrate an understanding of the behavior of a variety of functions and their graphs.
Grade 6
-
Underlying Processes and Mathematical Tools
- 11. The student applies Grade 6 mathematics to solve problems connected to everyday experiences, investigations in other disciplines, and activities in and outside of school.
- 13. The student uses logical reasoning to make conjectures and verify conclusions.
Grade 7
-
Underlying Processes and Mathematical Tools
- 13. The student applies Grade 7 mathematics to solve problems connected to everyday experiences, investigations in other disciplines, and activities in and outside of school.
- 15. The student uses logical reasoning to make conjectures and verify conclusions.
Grade 8
-
Underlying Processes and Mathematical Tools
- 14. The student applies Grade 8 mathematics to solve problems connected to everyday experiences, investigations in other disciplines, and activities in and outside of school.
- 16. The student uses logical reasoning to make conjectures and verify conclusions.
Algebra I
-
Foundation for Functions
- 1. The student understands that a function represents a dependence of one quantity on another and can be described in a variety of ways.
- 3. The student understands how algebra can be used to express generalizations and recognizes and uses the power of symbols to represent situations.
-
Linear Functions
- 6. The student understands the meaning of the slope and intercepts of the graphs of linear functions and zeros of linear functions and interprets and describes the effects of changes in parameters of linear functions in real-world and mathematical situations.
7th Grade
-
Patterns, Functions, and Algebra
- 7.19 The student will represent, analyze, and generalize a variety of patterns, including arithmetic sequences and geometric sequences, with tables, graphs, rules, and words in order to investigate and describe functional relationships.
8th Grade
-
Patterns, Functions, and Algebra
- 8.18 The student will use the following algebraic terms appropriately: domain, range, independent variable, and dependent variable.
- 8.14b relate and compare tables, graphs, and rules as different forms of representation for relationships.
Secondary
-
Algebra I
- A.18 The student will analyze a relation to determine whether a direct variation exists and represent it algebraically and graphically, if possible.
Be Prepared to
- explain how to predict the graph for a given path and initial velocity
- discuss why the path is straight while the graph is curved